Use case WF 3
Guild organization in marine phytoplankton, niche partitioning between and within phytoplankton size classes
Understanding how phytoplankton species manage to share an apparently homogeneous environment while maintaining high levels of diversity is a long-standing question in community ecology. Several mechanisms have been proposed to explain coexistence within phytoplankton assemblages, taking into account both the functional similarity among competing species and the internal or external drivers of population density fluctuations. In recent years, growing attention has been directed toward the size structure of phytoplankton guilds, both as a key aspect of biodiversity organization and as a determinant of ecosystem functioning and service provision. However, the links between size-structure organization and niche partitioning within phytoplankton guilds have received little attention so far. This case study explores these relationships by addressing two main questions: (1) is the available niche space partitioned among phytoplankton size classes? and (2) do taxa within a given size class further partition the available niche space? To investigate these questions, we developed a dedicated analytical workflow to examine niche partitioning patterns in phytoplankton guilds along the coastal areas of the entire Salento Peninsula.
Dataset used: Phytoplankton and abiotic data from seasonal sampling in the Ionian and Adriatic Seas
This case study is based on data collected during four seasonal oceanographic cruises conducted in March, June, September, and December 2000 along the southern Apulian coast (Adriatic and Ionian Seas, Italy), as part of the INTERREG II Italy–Greece Program. The dataset was obtained from 21 sampling stations distributed along seven transects perpendicular to the coastline, with three stations per transect located at distances of 3, 9, and 15 nautical miles from the shore. At each station, vertical profiles of the main physical properties of the water column were measured, and water samples were collected for phytoplankton and nutrient analyses. In total, the dataset includes records of 320 phytoplankton taxa, together with key abiotic parameters obtained from seasonal sampling along the same transects. Samples were collected at different depths to investigate the distribution patterns of dominant phytoplankton taxa along the main environmental gradients (niche axes).The dataset comprises a comprehensive list of taxa, density per taxon, and average individual body size, together with abiotic variables such as temperature, salinity, oxygen, nitrate, nitrite, ammonium, dissolved inorganic nitrogen (DIN), dissolved inorganic phosphorus (DIP), silicate, and depth, as well as total biomass and size fractionated biomass (micro, nano and pico Chlorophyll a and Primary Productivity). For this specific case study, only temperature, oxygen, DIN, DIP, silicate, and depth were used in the analyses. Additional details about the dataset used in this use case are publicly available through the LifeWatch Italy metadata catalogue at the following link: https://metadatacatalogue.lifewatchitaly.eu/geonetwork/srv/eng/catalog.search#/metadata/c66df408-917b-499a-a942-a28c2553aa7d
Methods
The workflow can start from the identification of the dominant species by selecting those within the 90th percentile of density and with a frequency of occurrence exceeding 10%. The biological data were then aligned with the environmental dataset, ensuring that each sampling station included a complete and consistent set of abiotic variables. Once integrated, the dominant taxa were grouped into body-size categories to facilitate comparisons both among and within size classes. Size classes were computed based on averaged biomass values and log-transformed using the natural logarithm. To describe the distribution of taxa within the ecological niche space and to identify the main environmental drivers influencing this distribution, a Canonical Correspondence Analysis (CCA) was applied. This analysis provided the position of each taxon along the first and second ordination axes, from which niche position and niche breadth values were derived. The CCA was further used to quantify the relative contribution of abiotic environmental variables and spatial variables in explaining the observed variation in phytoplankton body size and density distributions. If Outliers were identified, they were removed to refine the niche estimates, eventually performing CCA analysis again. In particular, taxa with niche optima falling outside ±2 standard deviations from the mean optimum within their respective size class were considered outliers and excluded. Further analyses examined how niche partitioning occurred among and within body size classes. The degree of niche overlap between taxa of different size classes was quantified, and summary statistics were calculated to describe the extent of overlap within each size class. At the end, considering only the two taxa most abundant in each size class (excluding the bigger one, size class 4, and the smaller one, size class -1) there are analyzed the mean overlap. In order to evaluate the robustness of these patterns, a null model was performed to assess the probability of observing the same level of niche partitioning between the two most abundant species in each size class by chance. Null model was performed both using Kernel Denity estimation (KDE) method and the Empirical cumulative distribution function (ECDF) to understand the value of the probability of the modelized value related to observed value, and so if the null hypothesis can be rejected or accepted.
Results
From the original dataset, 63 phytoplankton taxa belonging to six logarithmic size classes (-1;0;1;2;3;4) were selected based on their frequency of occurrence and density. The Canonical Correspondence Analysis (CCA) performed on the 63 taxa and six abiotic variables revealed clear patterns in species–environment relationships (Figure 1). CCA Axis 1 explained 53% of the constrained variance, and was strongly associated with temperature, which showed a positive loading (0.492), and with a positive contribution from dissolved oxygen (DO) (0.569). In contrast, DIN (–0.638) and silicate (–0.447) displayed strong negative loadings. This indicates that Axis 1 represents a gradient ranging from warm, oxygen-rich waters to cooler, nutrient-rich conditions characterized by elevated inorganic nitrogen and silicate concentrations. CCA Axis 2 explained 26% of the constrained variance and was dominated by a pronounced positive loading of DIN (0.614). Depth (–0.167), silicate (–0.266), DIP (–0.309), and temperature (–0.054) all loaded negatively on this axis. These patterns suggest that Axis 2 primarily reflects a gradient in oxygen availability, separating highly oxygenated environments from deeper, cooler, and more nutrient-depleted waters.
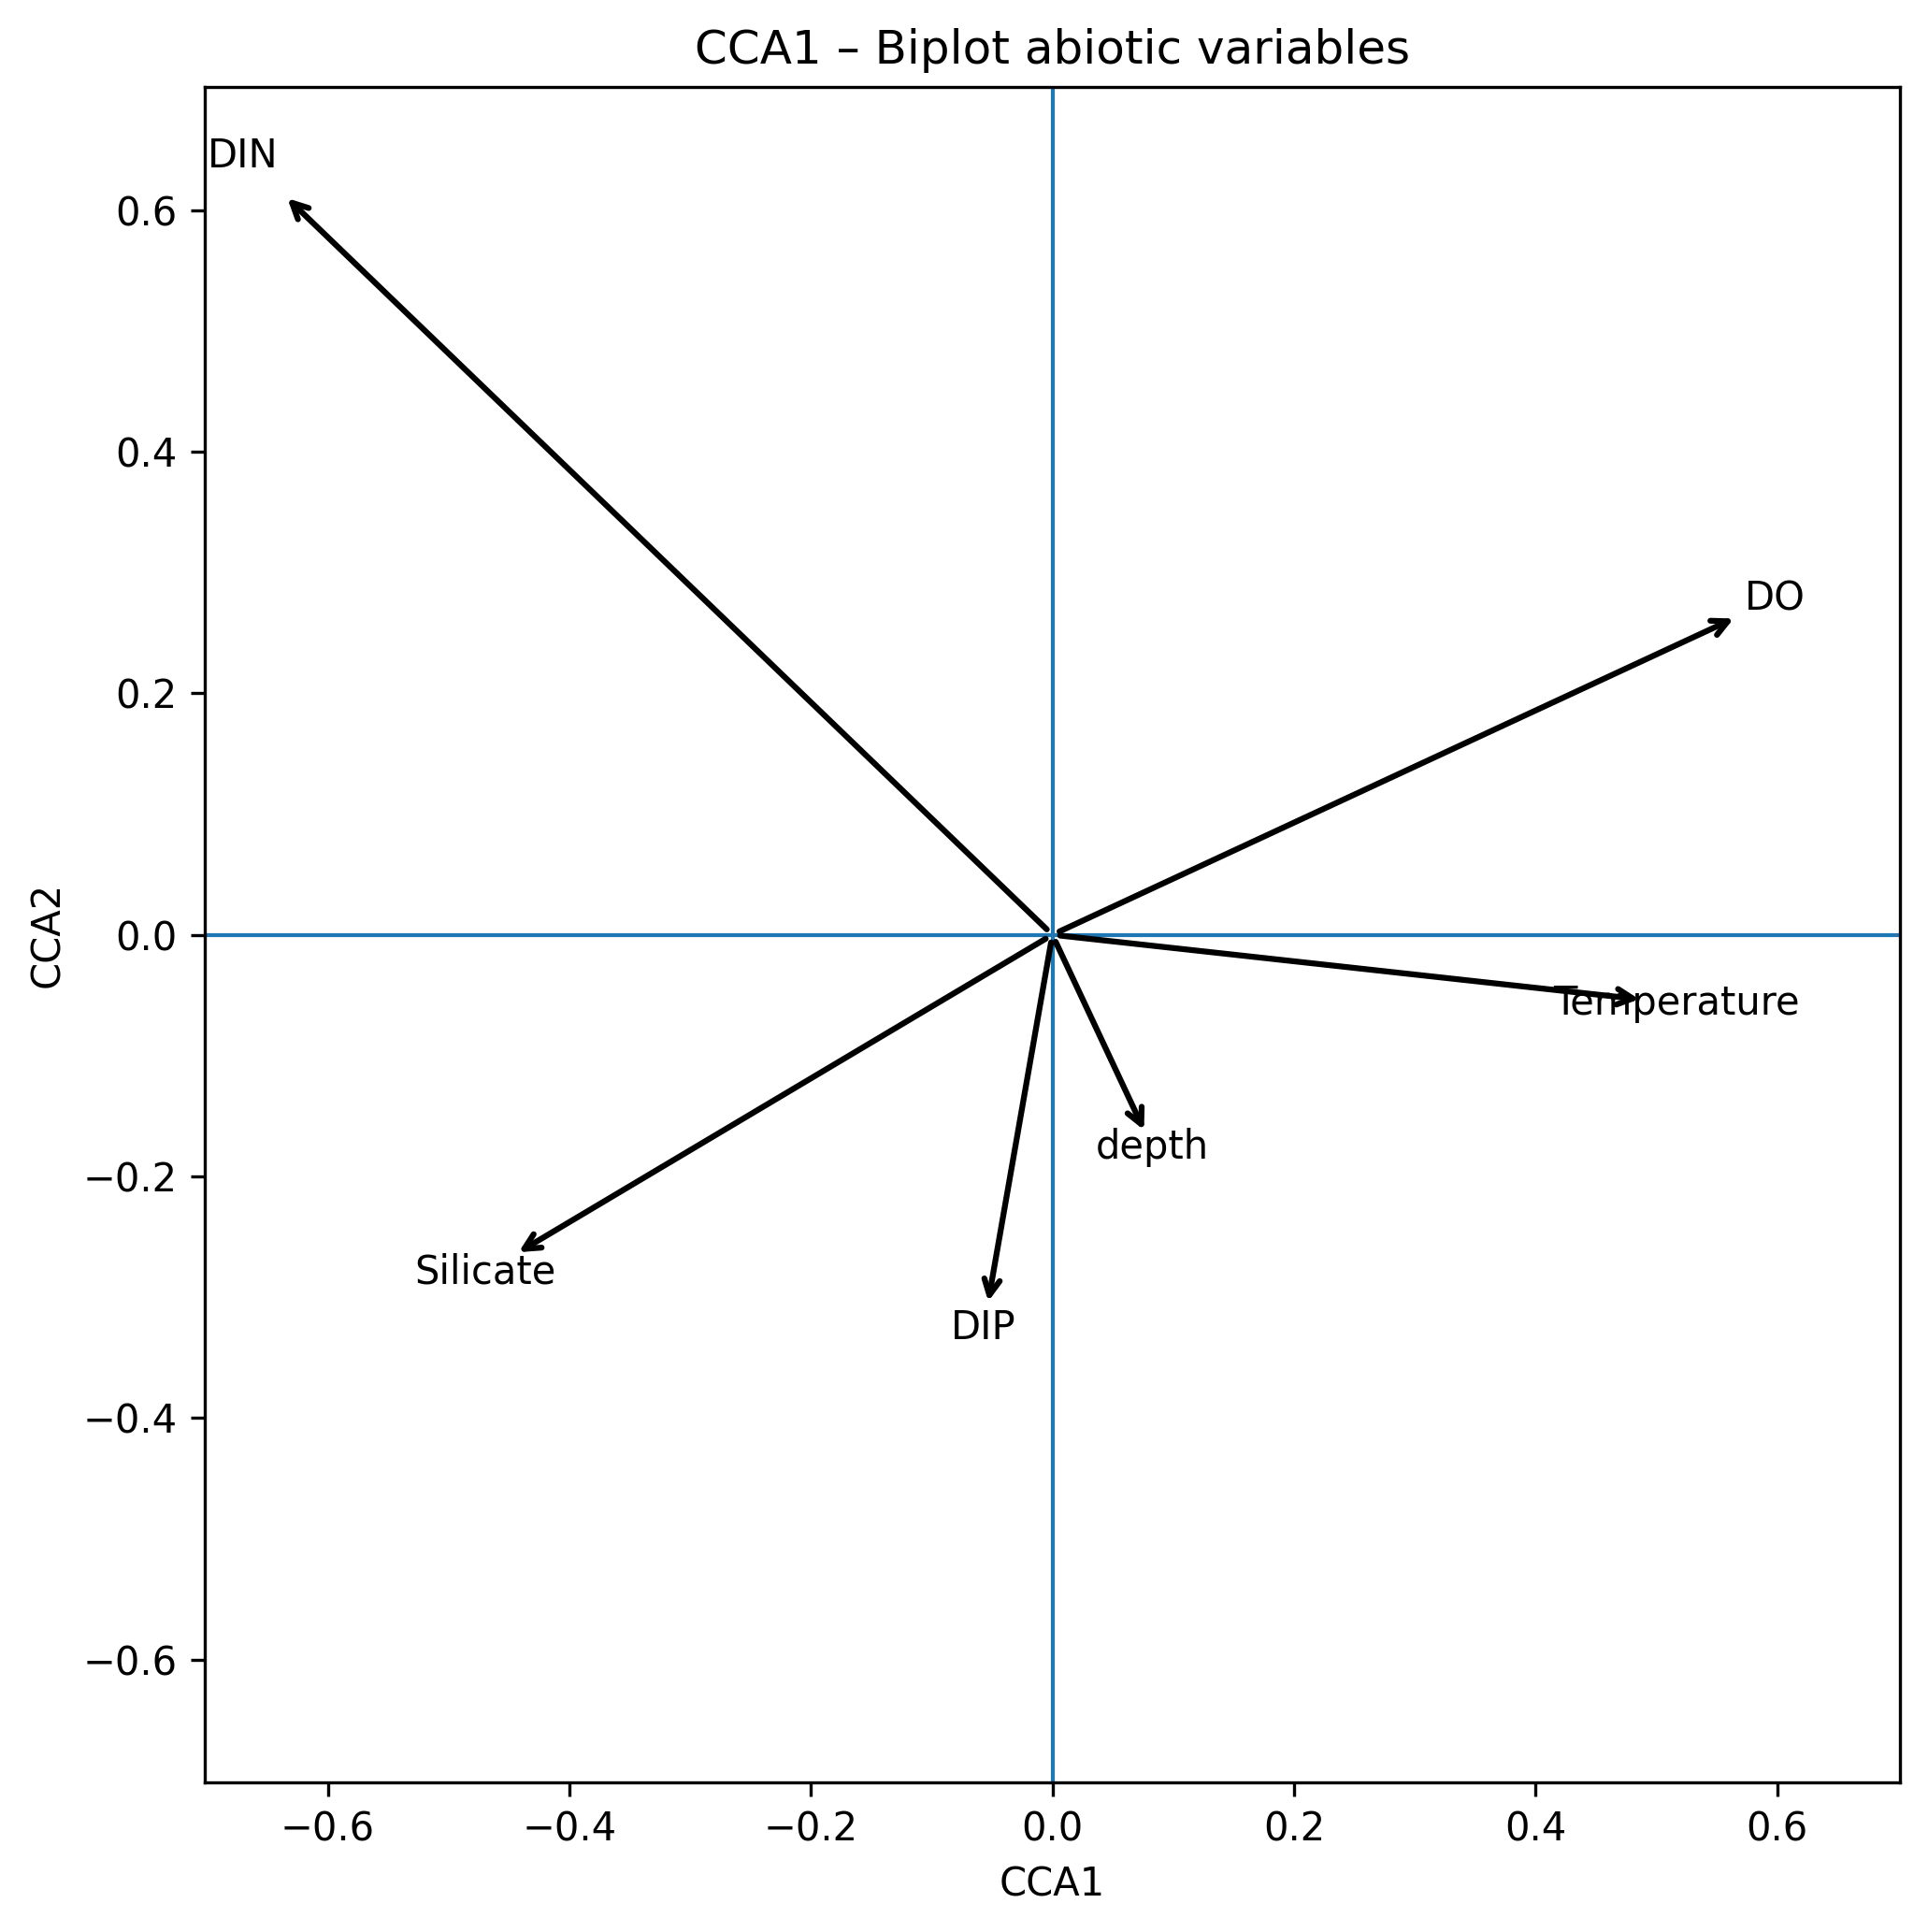
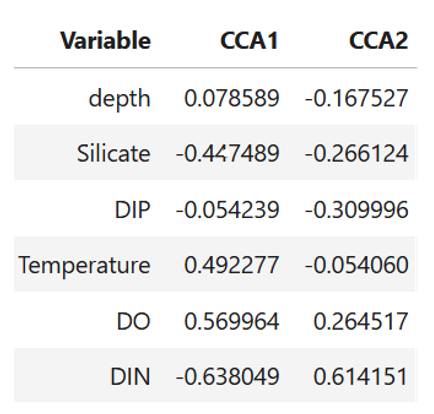
Figure 1. CCA biplot of the 63taxa and six environmental variables and relative contribution of the six environmental variables to the composition of the multidimesional niche axes.
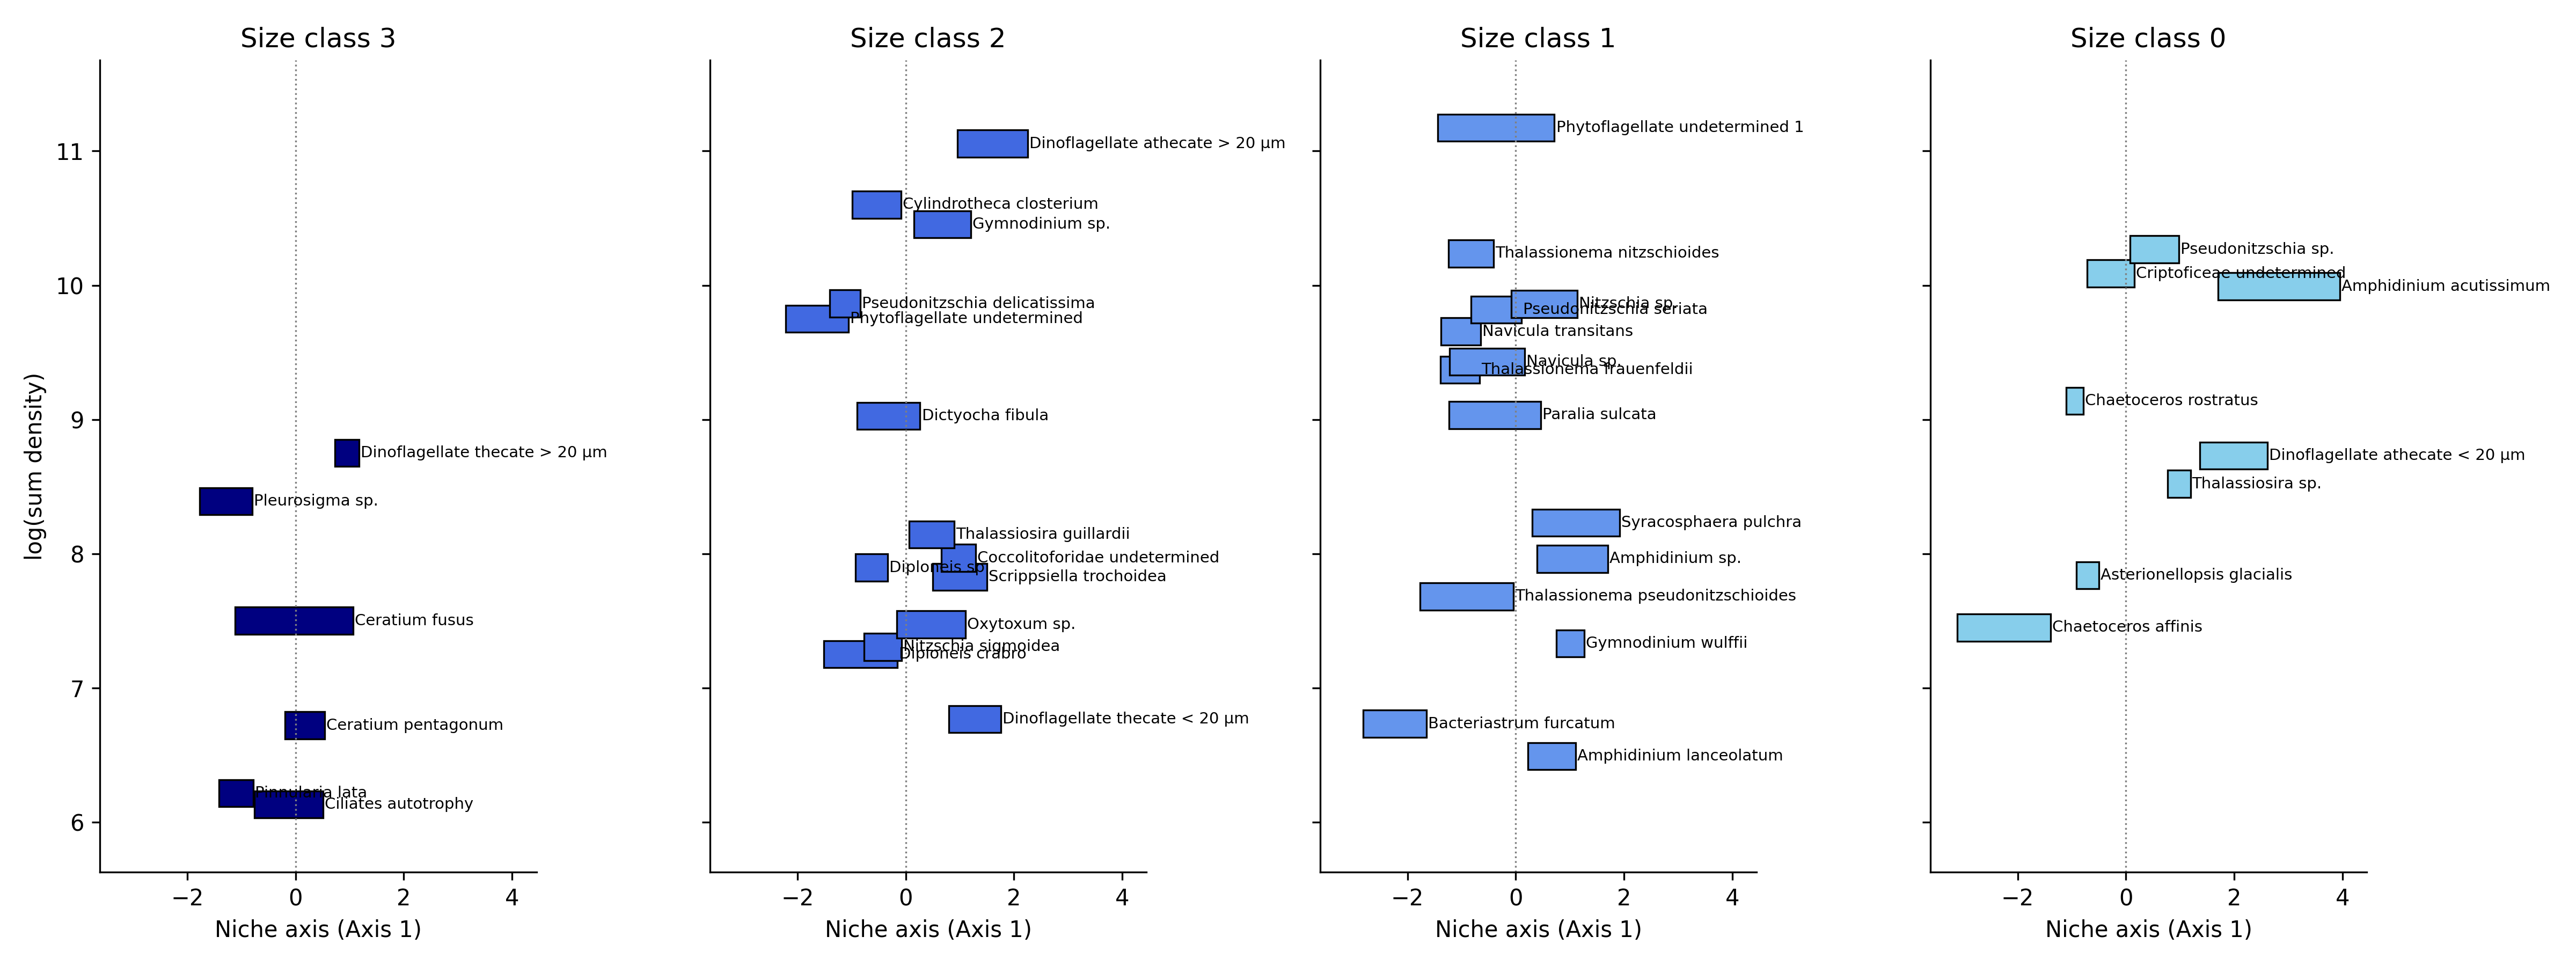
Across the two CCA axes, taxa display clear multidimensional niche partitioning. Along Axis 1, species show a combination of broad and narrow optima depending on size class. Smaller size classes (–1, 0, 1) include taxa that span wide portions of the gradient, but several species, particularly in size classes –1 and 1, exhibit strongly polarized responses, peaking at opposite ends of the axis. In contrast, larger size classes (3–4) tend to show narrower, well-defined optima, indicating more specialized responses while still aligning along a continuous environmental gradient. Overall, Axis 1 reflects a mixture of broad niche occupancy and progressive ecological turnover, with species replacing one another along the gradient rather than forming discrete clusters (Figure 2a). Along Axis 2, niche separation becomes more pronounced. Several size classes, especially size class 1 and size class 3, contain taxa with sharply peaked optima concentrated at the extreme ends of the axis, resulting in minimal overlap and clear ecological specialization. Even within size class 2, where species richness is highest, taxa display distinct maxima distributed across the entire gradient, showing substantial differentiation among co-occurring species. Size class 0 also includes species with very steep responses at one extreme of the axis, reinforcing the stronger polarization visible along Axis 2. This axis therefore represents a more contrasting environmental gradient along which taxa segregate into clearly separated ecological positions (Figure 2b).Together, the two axes illustrate how the community occupies environmental space through both continuous niche turnover (Axis 1) and strongly polarized specialization (Axis 2). Smaller size classes contribute to broad gradients of variation, whereas intermediate and larger size classes display narrower and more sharply defined niches . This multidimensional structure highlights a complex and organized niche architecture that supports the coexistence of a diverse assemblage.
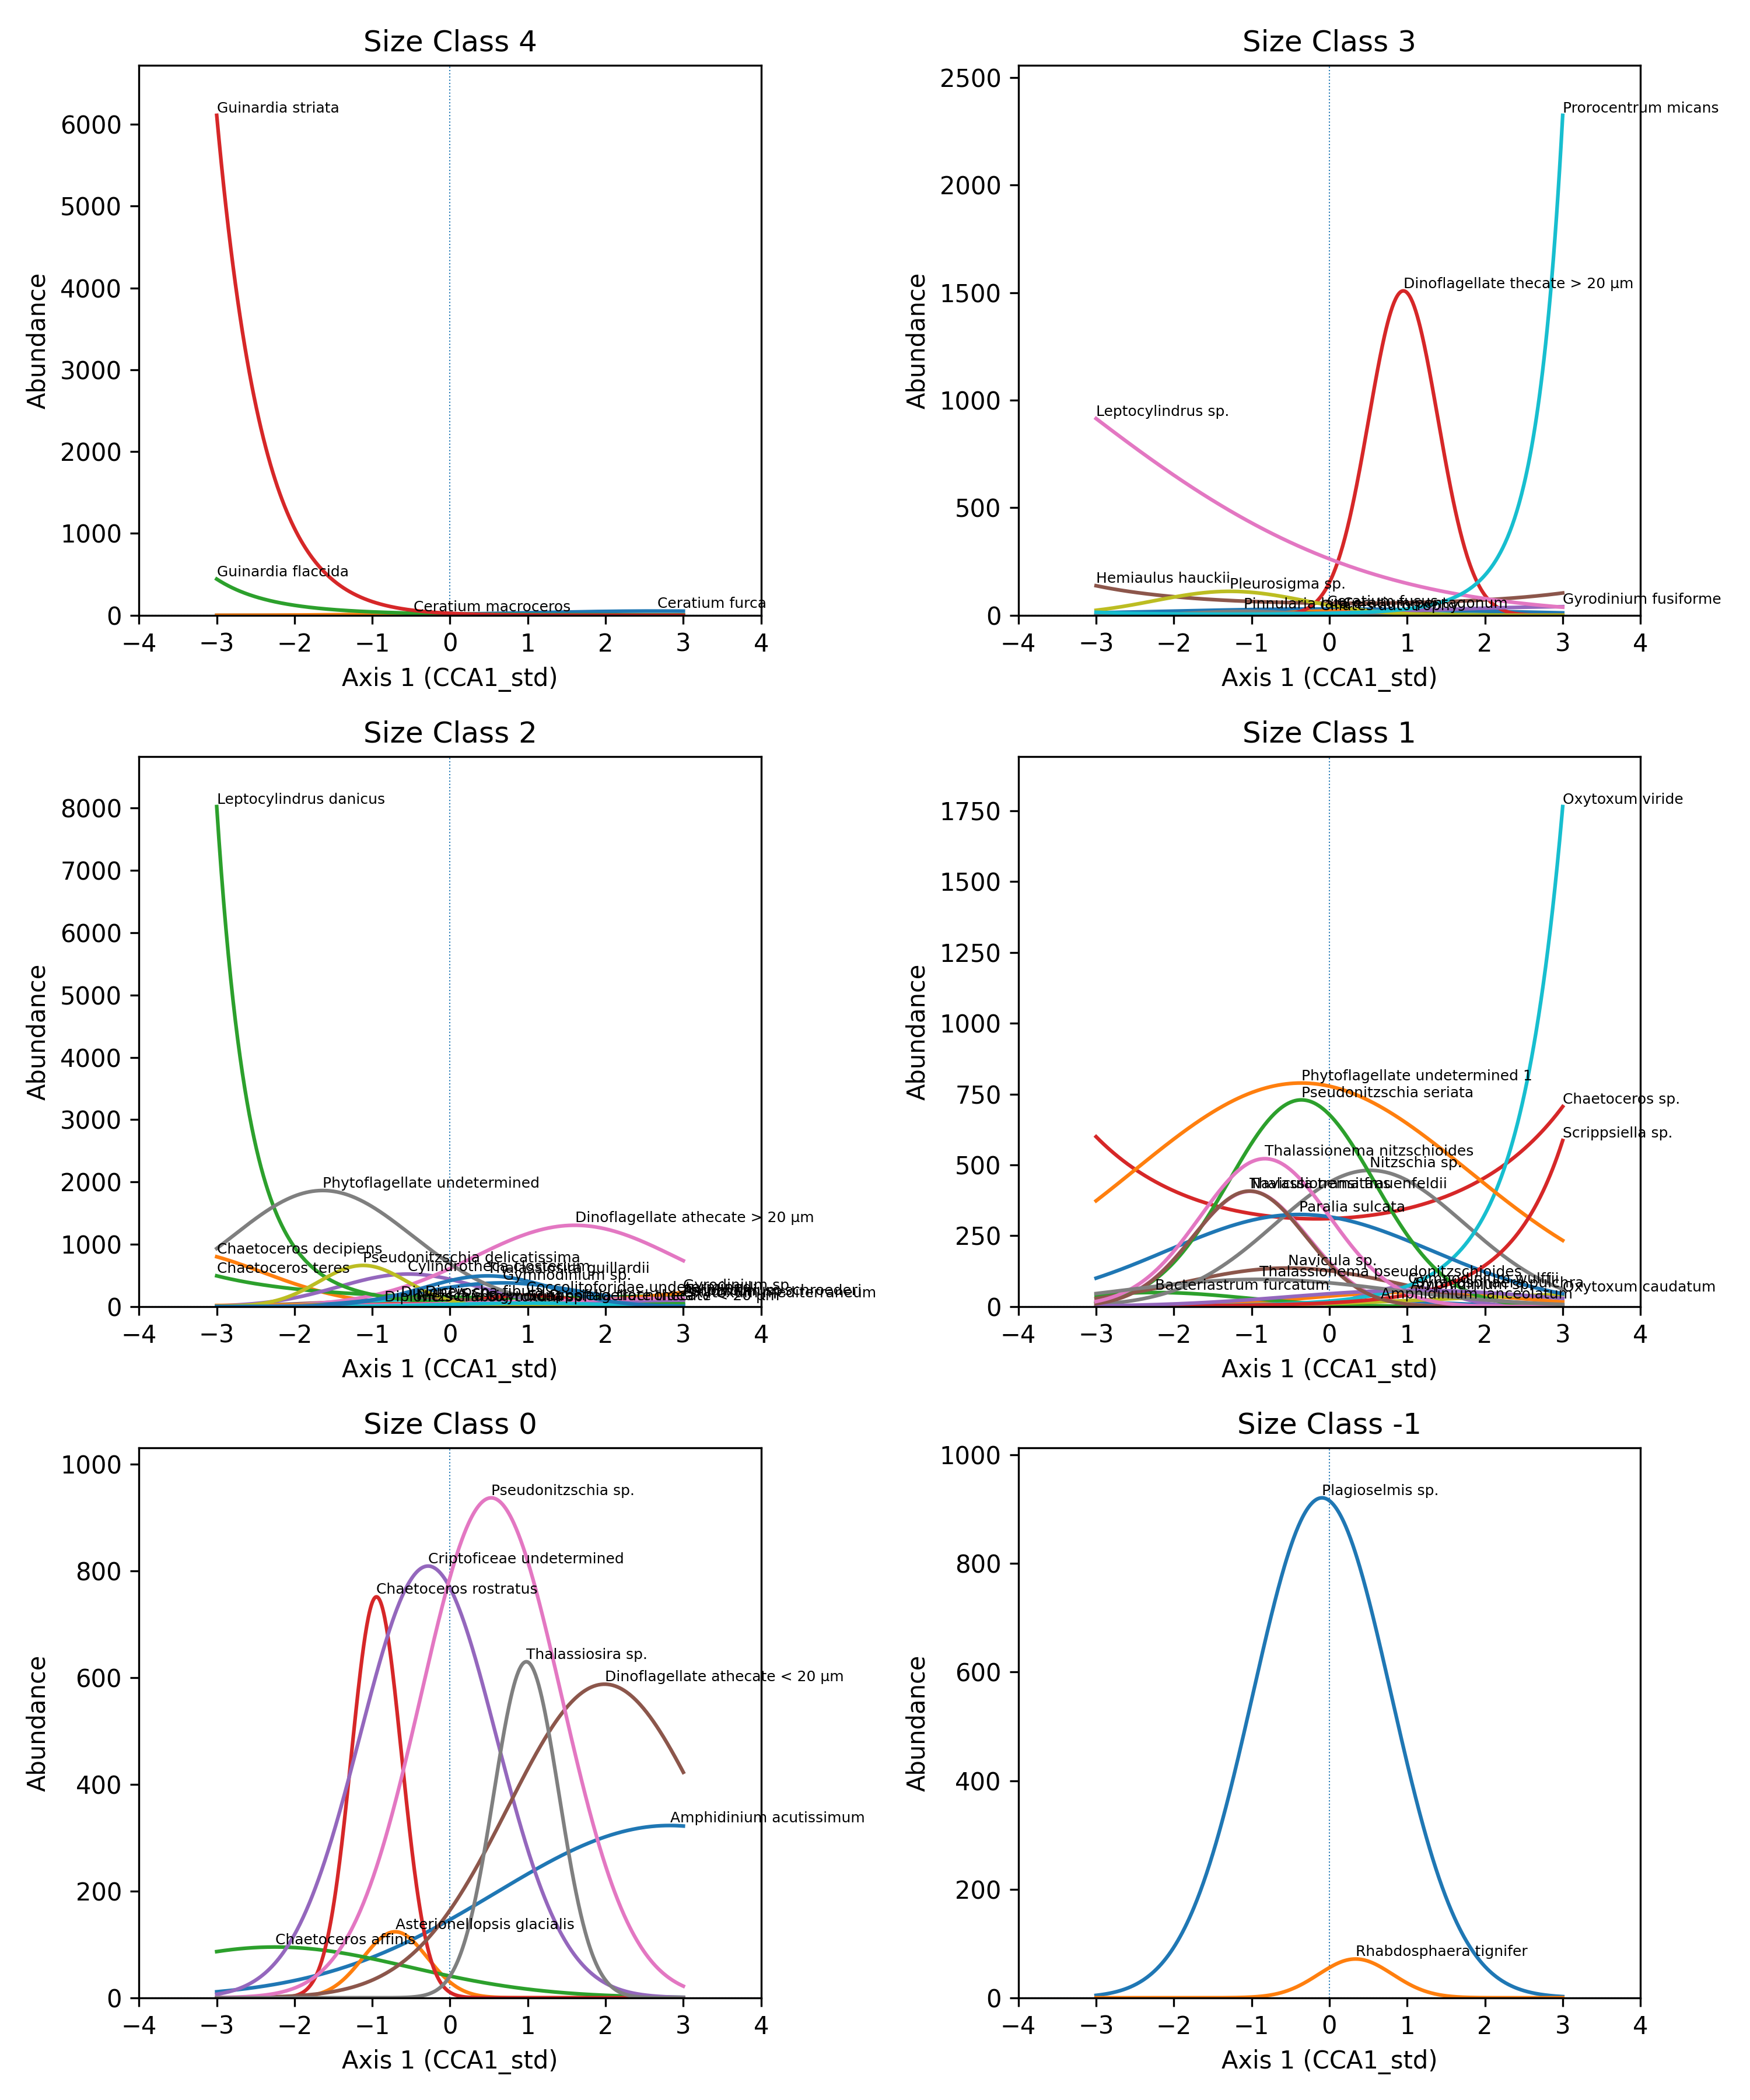
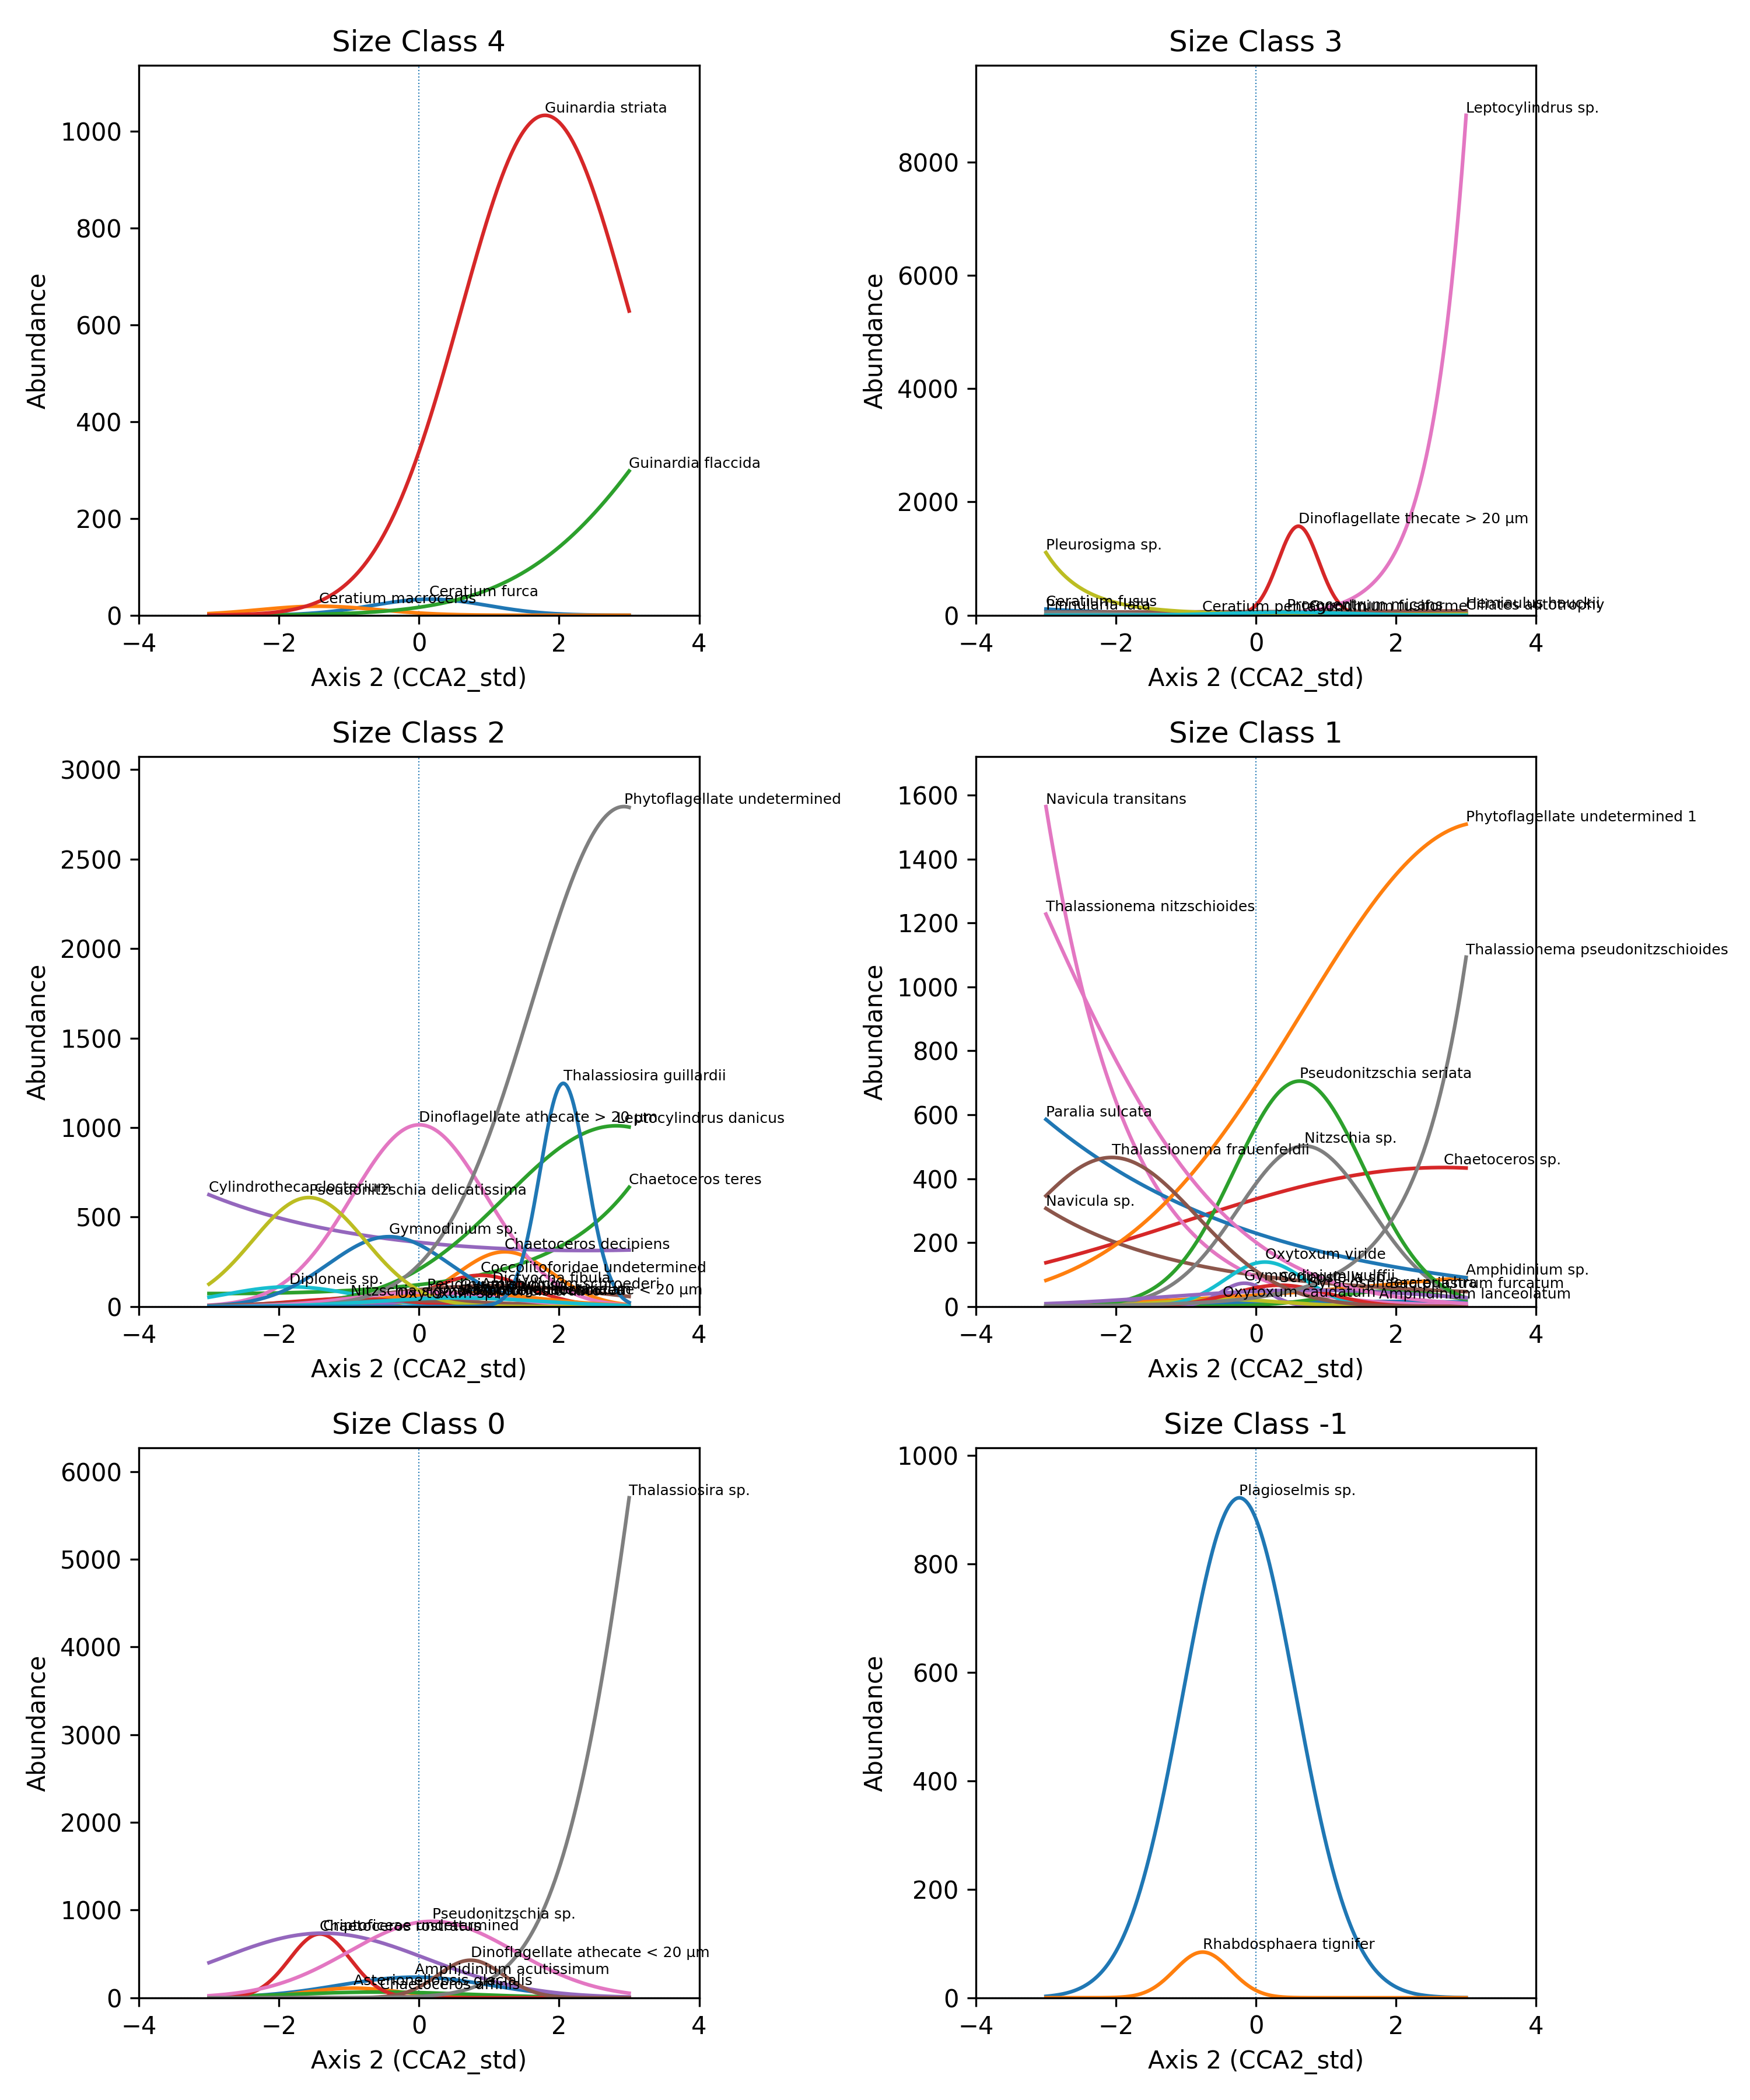
Figure 2. Niche partitioning of the 63 taxa within size classes: a) along Axis 1, b) along Axis 2.
When comparing niche overlap between size classes, the results showed that body size classes share similar niche positions and exhibit a high degree of overlap in niche space along Axis 1 , whereas along Axis 2 several size classes exhibit lower overlap, indicating stronger niche segregation (Figure 3a, b).
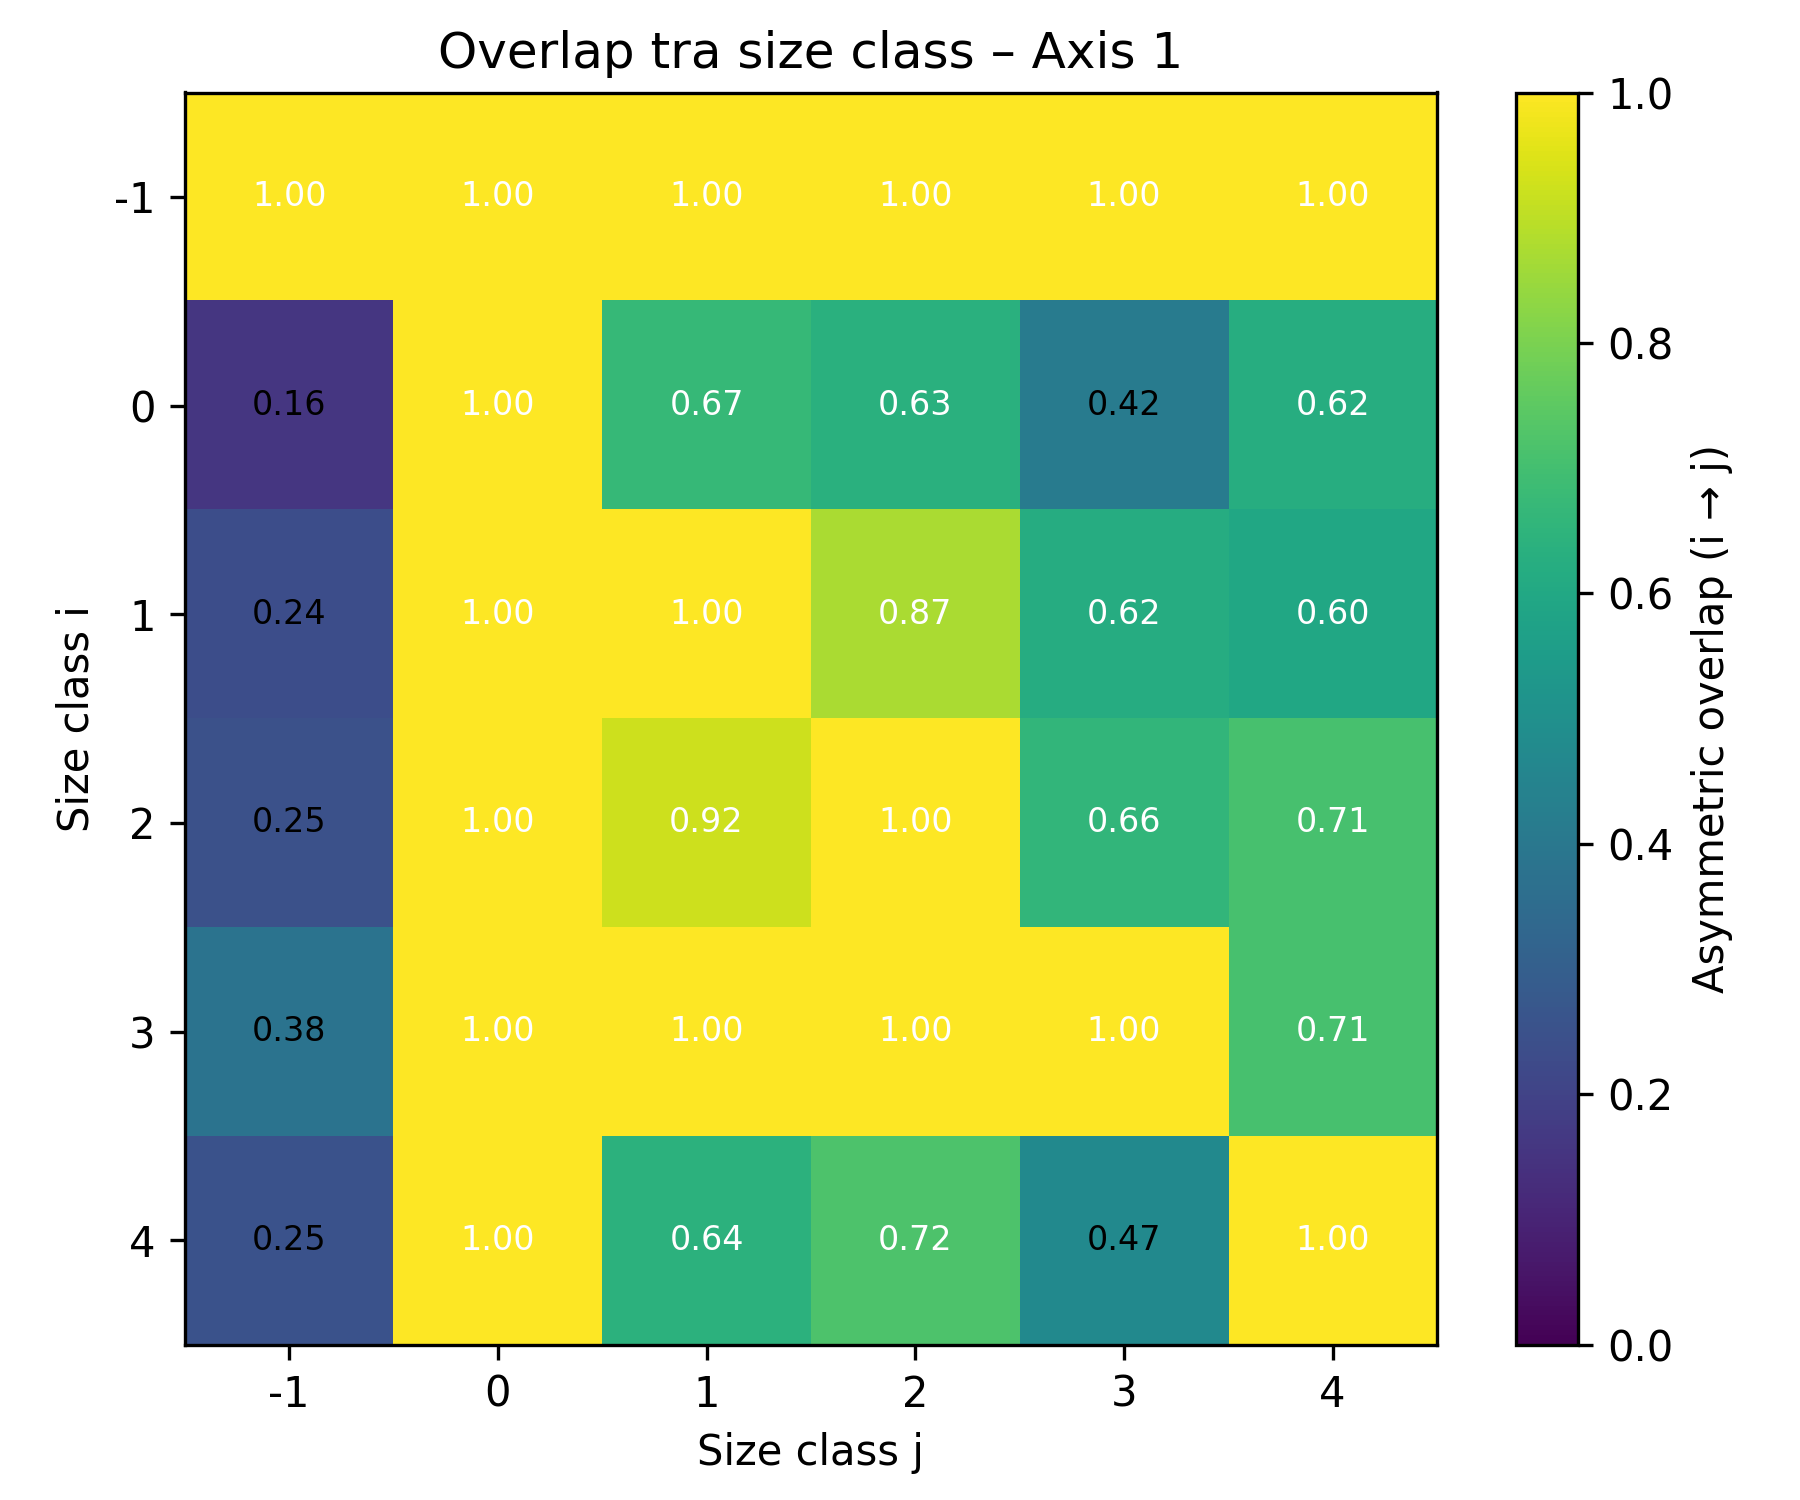
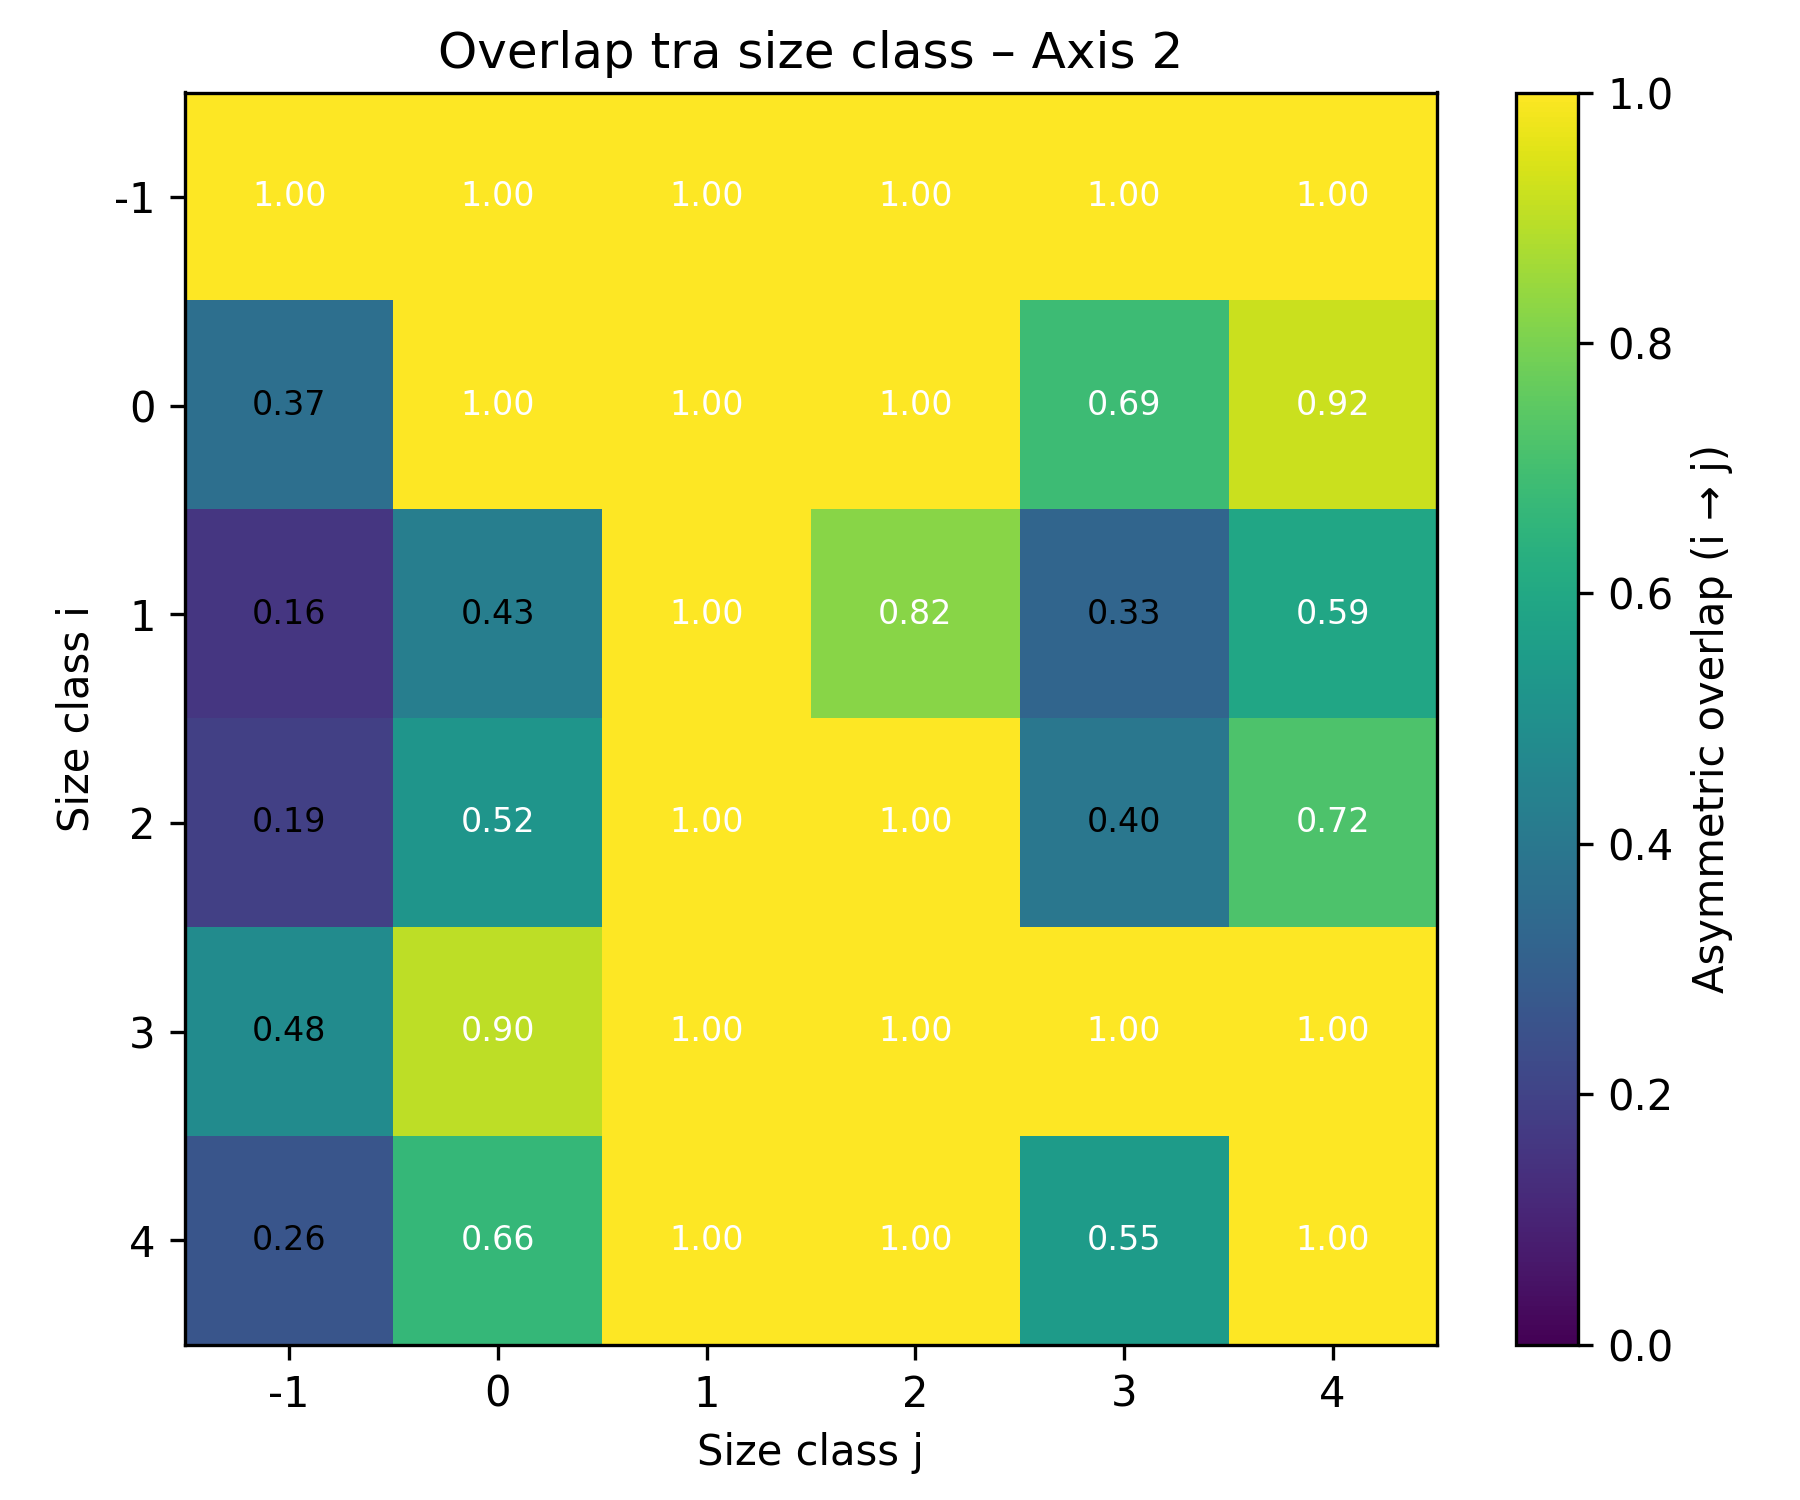
Figure 3. Niche overlaps between size class a) along Axis 1, b) along Axis 2.
On axis 1 there are analyzed the two taxa more abundant and how they are overlapping, in figure 4 below are reported the graphs of positioning along axis 1 in each size class of all taxa (excluding the bigger and smaller classes, because they have only two taxa per class).
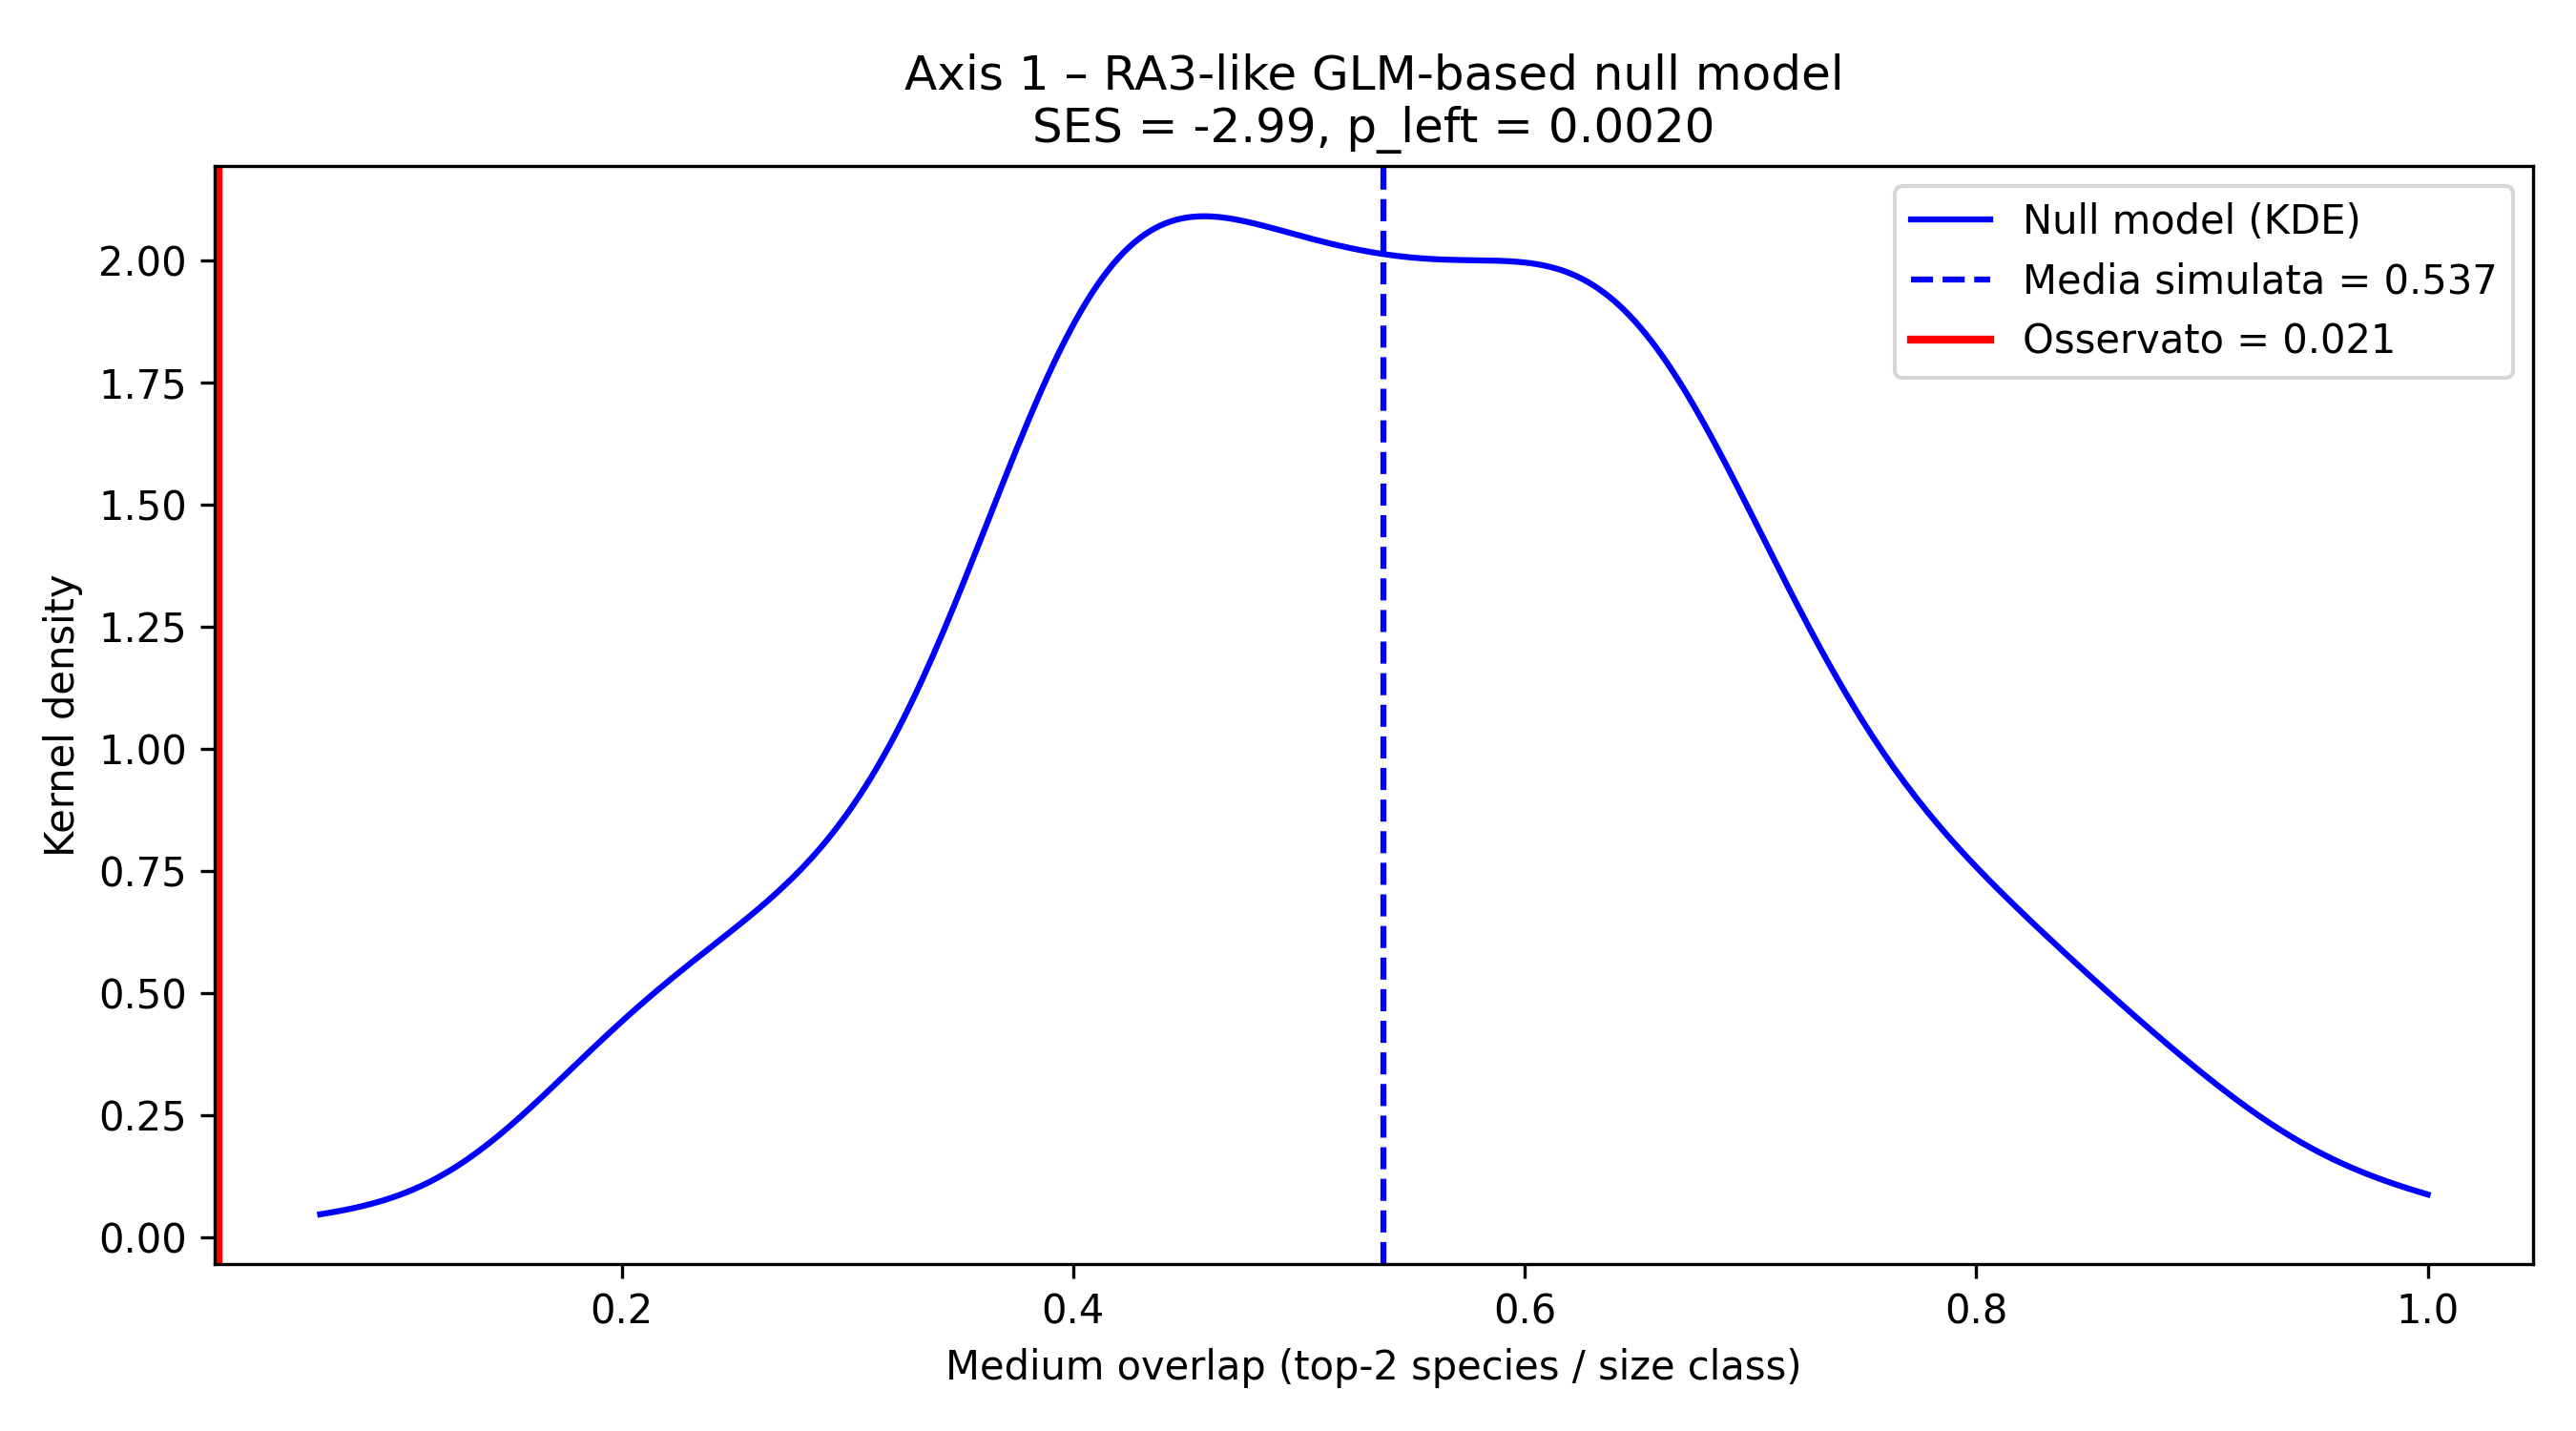
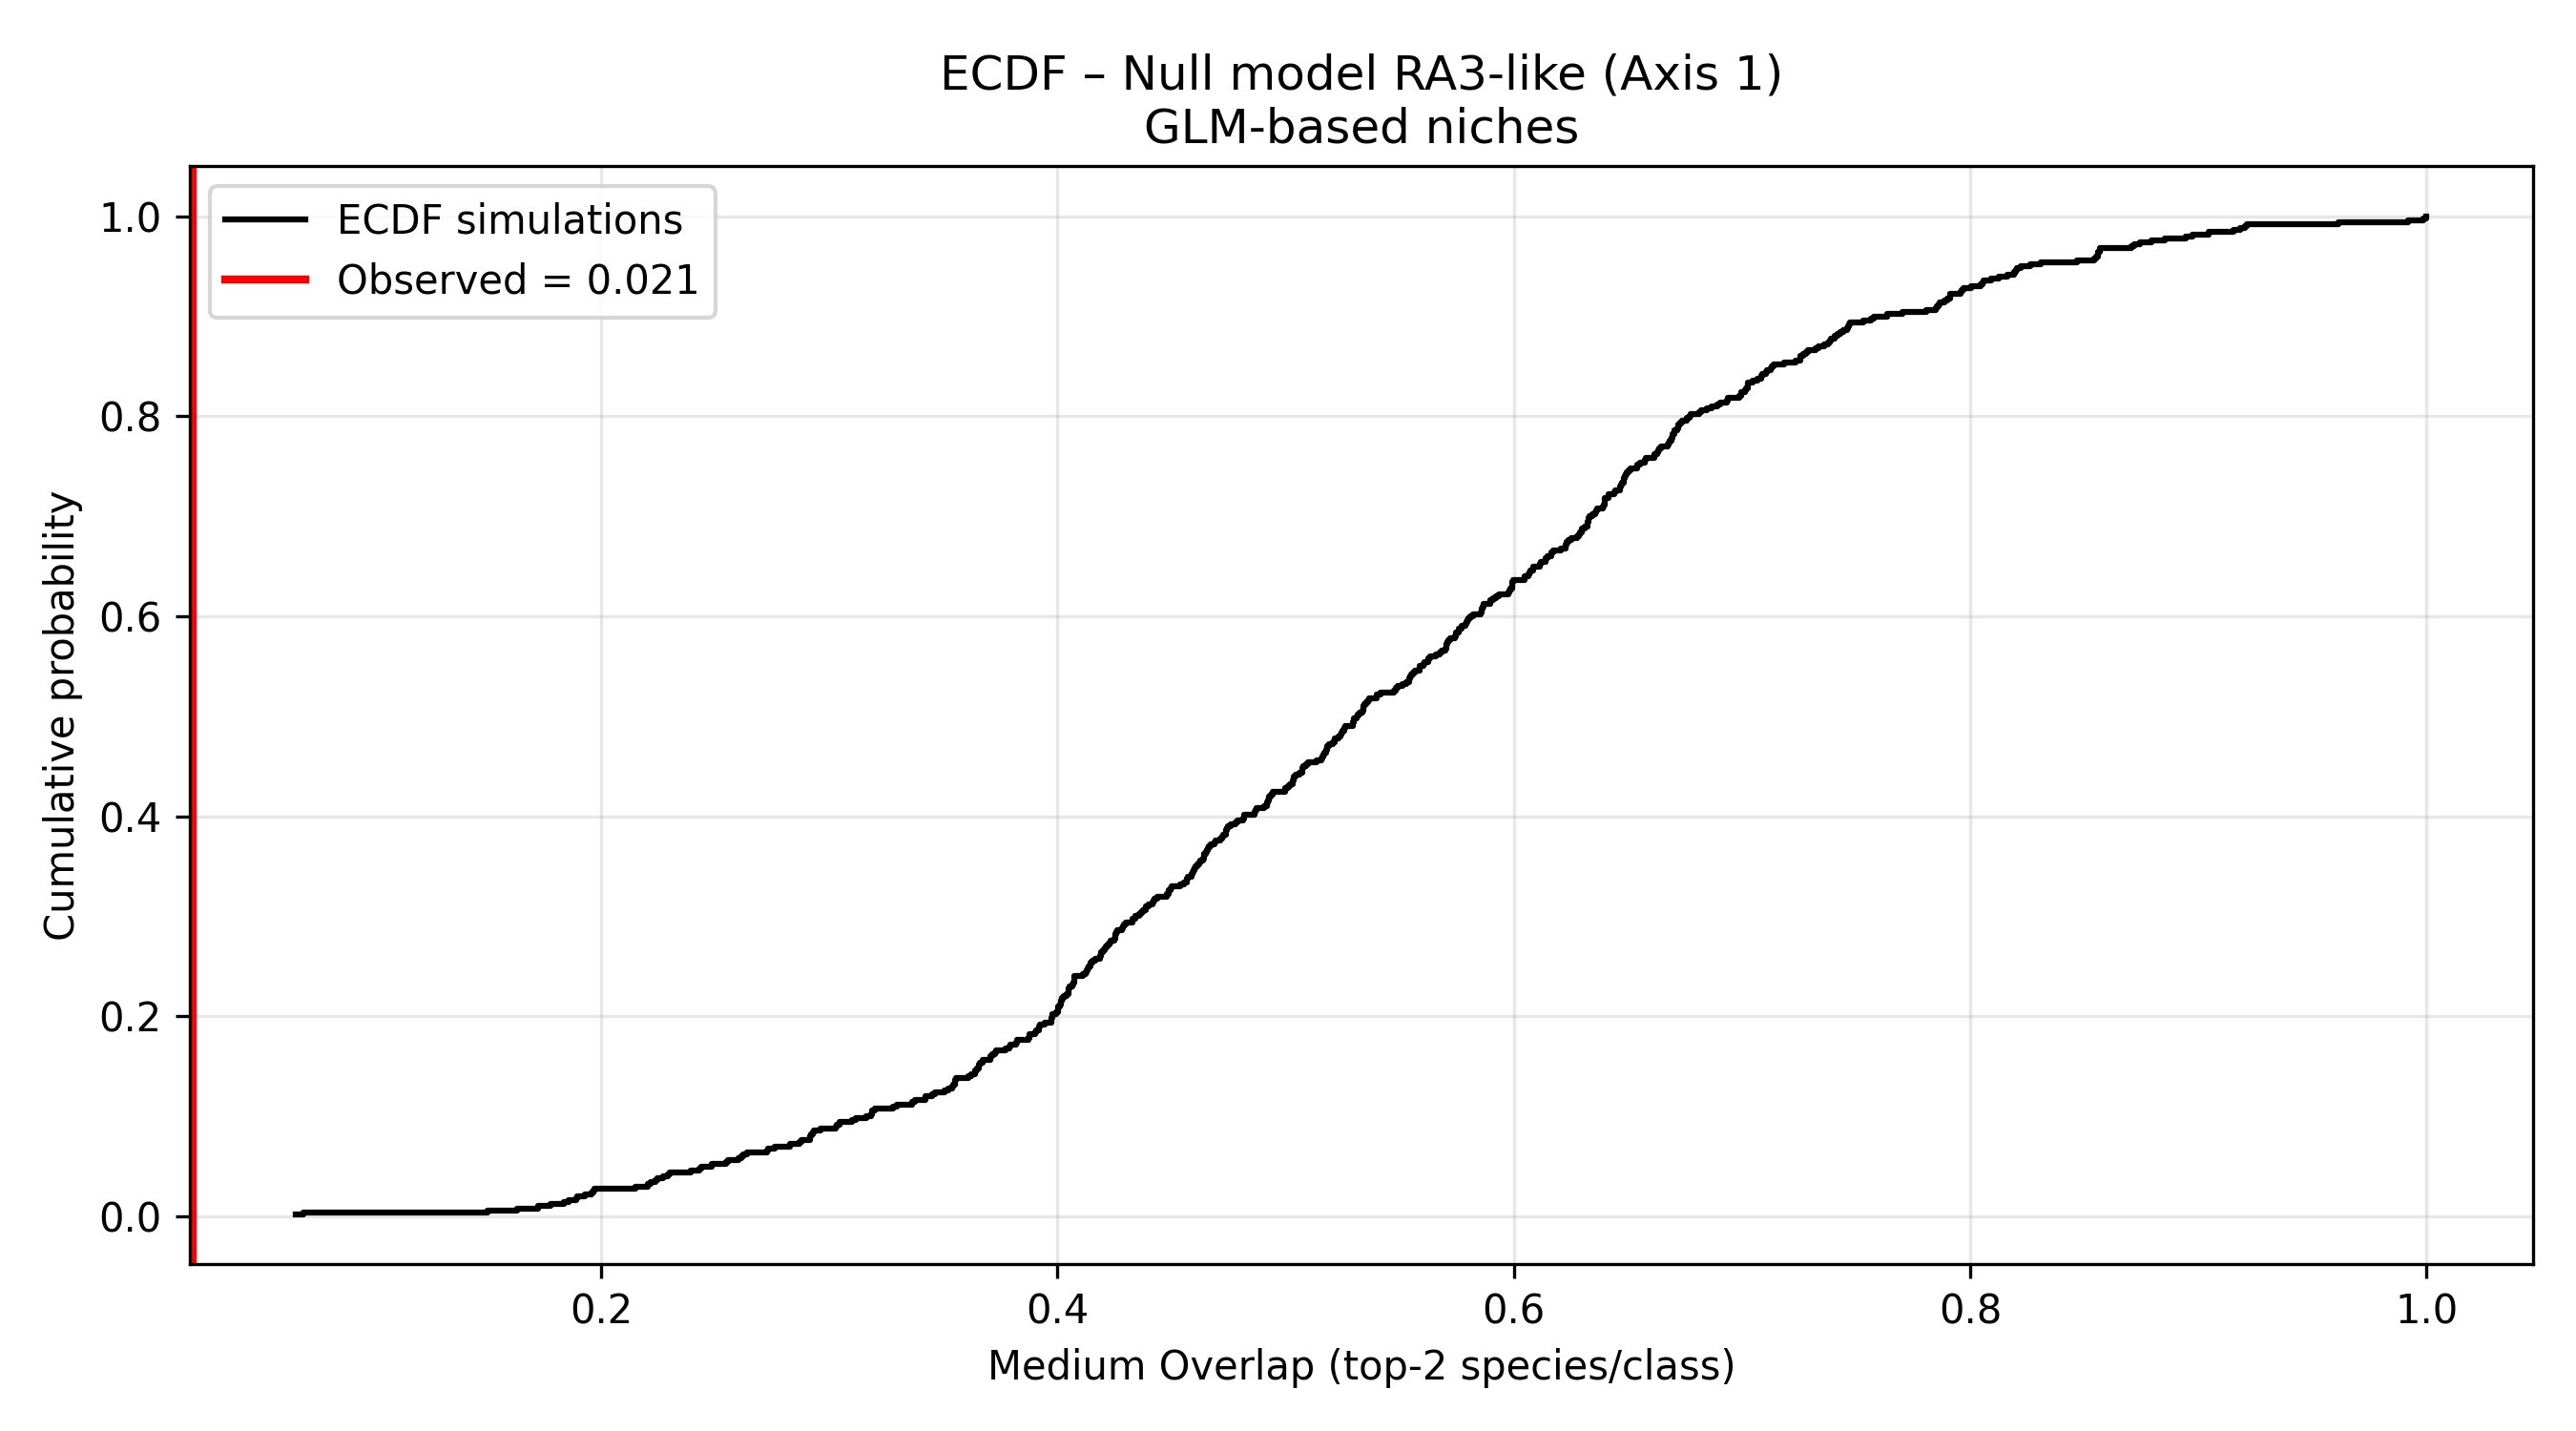
Null models for the two pecies more abundant in each size class, reveal that observed values are less than model values, so these overlapping on axis 1 is not sufficient to reject the null hypotesis, and the conclusion is that the overlapping between species on this axis is randomic or depending on other causes, like nutrients or parameters on axis 2. Figures 5a and 5b indicate the graphs of the two null models performed (KDE and ECDF) on axis 1.
These findings highlight the central role of individual size in structuring phytoplankton guilds and suggest that the size structure of phytoplankton communities is shaped by both abiotic environmental constraints (i.e., niche filtering) and size-related intra-guild coexistence mechanisms. Considering the hierarchical organization of phytoplankton guilds, our results indicate that (i) the distribution of taxa among size classes, (ii) the niche partitioning of dominant taxa within each size class jointly contribute to the organization and maintenance of taxonomic diversity in marine phytoplankton communities.
Technical notes
The workflow produces a series of analytical outputs, including multidimensional representations of taxa positions along the ordination axes, metrics of niche position and niche breadth, and final validated datasets describing within- and among-class patterns of niche overlap. It is possible to visualize and analyze how the two most abundant species in each size class are overlapped. These outputs provided the basis for interpreting the ecological structure and mechanisms of niche differentiation within the studied community. Moreover, the analytical framework is highly flexible and can be applied to similar datasets or extended to explore different ecological parameters, allowing comparative analyses across taxa, environments, or temporal scales.
References
The preliminary results of this case study were presented as an oral contribution at the International Symposium on Biodiversity and Ecosystem Functions under Global Change, during the dedicated session “Biodiversity Goes Digital – Biodiversity Monitoring Networks”, held in Alghero on November 12–14, 2025, by Alberto Basset, Lorenzo Liberatore, Mariantonietta La Marra, Teodoro Semeraro, Milad Shokri, and Jessica Titocci.
Other articles published using the same datasets include:
Sabetta, L., Fiocca, A., Margheriti, L., Vignes, F., Basset, A., Mangoni, O., … & Ianni, C. (2005). Body size–abundance distributions of nano- and micro-phytoplankton guilds in coastal marine ecosystems. Estuarine, Coastal and Shelf Science, 63(4), 645–663.
Sabetta, L., Basset, A., & Spezie, G. (2008). Marine phytoplankton size–frequency distributions: Spatial patterns and decoding mechanisms. Estuarine, Coastal and Shelf Science, 80(1), 181–192.