Use case WF 2
Taxonomic and Functional approaches to temporal phytoplankton dynamics in Umbrian Lakes
Understanding how ecological communities respond to environmental gradients is a central goal in ecology. Traditional taxonomic approaches describe species composition but often fail to capture the ecological strategies that determine how communities assemble and respond to environmental change. Trait-based approaches overcome this limitation by focusing on morphological, physiological, and behavioral traits that influence species’ performance, resource use, and interactions with the environment. Functional traits offer a mechanistic basis for interpreting and predicting community structure across environmental gradients, because they directly reflect how organisms cope with constraints such as nutrient limitation, light variability, temperature fluctuations, and predation pressure. In phytoplankton communities, traits such as cell size, shape, motility, coloniality, and mixotrophy are tightly linked to growth rates, sinking losses, nutrient uptake efficiency, and the ability to exploit heterogeneous environmental conditions. As a result, trait-based analyses provide powerful insights into functional diversity and the environmental filters that shape community assembly. Despite their conceptual advantages, trait-based approaches have rarely been applied to long-term phytoplankton datasets.
The aim of this workflow is to apply a traditional and trait-based approach to a phytoplankton time-series dataset from Umbrian lakes in order to:
- describe phytoplankton community composition
- describe patterns of diversity and functional diversity over time;
- evaluate relationships between functional diversity and functional groups and environmental gradients;
This approach allows to link species strategies to ecosystem dynamics and to identify potential signals of environmental and climate-driven shifts in phytoplankton communities.
Dataset used: Long-term dataset of freshwater phytoplankton in Umbrian lakes
The dataset includes:
- Phytoplankton Data Table: This includes species density and biomass values collected between 2009 and 2022 with bi-monthly sampling. The data covers 692 species across 9 phyla, 22 classes, 64 orders, and 155 families.
- Abiotic Data Table: This table contains physico-chemical environmental parameters, such as alkalinity, Total Nitrogen, Total Phosphorus, Dissolved Organic Carbon, Conductivity, , Dissolved Oxygen, pH, Depth, Silica, Temperature, Transparency.
- Functional Trait Table: A table which includes functional groups and traits categorical information (mostly binary values: 0-1) related to morphology (shape, presence of external structures), behavior (motility), physiology (trophic levels), and reproductive traits for freshwater phytoplankton species.
Phytoplankton and abiotic data have been collected from water bodies across the Umbria region, during the monitoring phase carried out by ARPA UMBRIA which includes 8 lakes (2 natural – Trasimeno and Colfiorito) and 6 heavily modified water bodies (HMWBs). Additional details about the dataset used in this use case are publicly available through the LifeWatch Italy metadata catalogue at the following link: https://metadatacatalogue.lifewatchitaly.eu/geonetwork/srv/eng/catalog.search#/metadata/18a16c1c-1296-47be-84f0-c27c7f1520f8
Methods
The workflow begins by compiling all phytoplankton records from Umbrian lakes (2009–2022) into a standardized database, harmonizing taxonomy, cell density, biovolume and associated environmental variables. The analysis first describes multi-lake phytoplankton patterns from a taxonomic and compositional perspective, and subsequently assesses long-term temporal dynamics and trait-based community assembly. Community change across the seven lakes is examined using two complementary biodiversity approaches:
(1) traditional taxonomic metrics (taxa richness, Shannon diversity), and
(2) functional metrics (Rao’s quadratic entropy, functional dispersion FDis and functional redundancy).
For functional diversity analyses, taxa are matched to a curated trait database containing binary functional attributes describing morphology and ecological strategies. Only traits with adequate representation and informative frequency across species are retained. Community data are transformed into abundance-weighted species × trait matrices for each lake and year. Rao’s quadratic entropy (RaoQ) is computed as the abundance-weighted mean Gower distance among all species pairs, whereas functional dispersion (FDis) is calculated as the abundance-weighted mean distance to the community centroid in multidimensional trait space. Functional redundancy is estimated as the difference between scaled species richness and scaled RaoQ within each lake, providing a relative measure of overlap in trait space. Environmental controls on functional structure are explored by relating annual functional metrics (RaoQ, FDis and functional redundancy) to lake-specific abiotic conditions. Pearson correlations between each functional index and each environmental variable are computed independently for each lake. Because Lake Trasimeno exhibits the strongest functional trends and clearest correlation patterns, a dedicated analysis is performed for this system. Functional metrics for Trasimeno are regressed against individual environmental predictors using simple linear models, followed by multivariate OLS models including standardized predictors (year, nitrogen and phosphorus fractions, temperature and alkalinity). To complement the univariate analyses, community-level trait-based clustering is performed using the k-prototypes algorithm. Categorical traits include motility, life form, cell shape, toxin production and trophic strategy; numerical variables include log₁₀-transformed phytoplankton density (Density_log10) and all available environmental measurements. To visualise the relationship between functional clusters and taxonomy, a Sankey diagram is constructed linking taxonomic class (or phylum when class information is unavailable) to cluster identity, retaining the 15 most abundant classes. For the environmental characterisation of clusters, only ecologically relevant variables are considered. Differences among clusters are evaluated with Kruskal–Wallis one-way ANOVA on ranks, applied separately to each variable. For variables with p < 0.05, Dunn’s post-hoc tests with Bonferroni correction are performed. In addition, Levene’s test (trimmed mean) is applied to key variables (nutrients, temperature and dissolved oxygen) to assess homogeneity of variances among clusters.
Results
Phytoplankton density and biovolume dynamics across lakes
Across the 2009–2022 period, total phytoplankton density and community composition showed strong temporal and spatial variability (Figure 1a, Table 1). The Colfiorito lake displayed the most extreme values, with cyanobacterial densities peaking at about 4.8 × 10⁹ cells L⁻¹ in 2012 and 1.3 × 10⁹ cells L⁻¹ in 2015. Similarly high cyanobacterial abundances were recorded in Lake Trasimeno, where densities reached 2.27 × 10⁹ cells L⁻¹ in 2016 and 1.69 × 10⁹ cells L⁻¹ in 2009, and in Corbara, with maxima of approximately 7.9 × 10⁸ cells L⁻¹ in 2017 and around 4 × 10⁸ cells L⁻¹ in 2018 and 2022. In contrast, maximum total densities in Aia and San Liberato remained on the order of 10⁷ cells L⁻¹, while Arezzo and Piediluco rarely exceeded 10⁸ cells L⁻¹, despite occasional peaks in cryptophytes and diatoms (e.g. Heterokontophyta > 1.5 × 10⁸ cells L⁻¹ in Piediluco in 2021–2022). In all systems, Heterokontophyta and Chlorophyta formed a persistent background community, whereas cryptophytes and especially cyanobacteria were responsible for most of the interannual density peaks. Patterns in total biovolume (Figure 1b) broadly mirrored those in density but emphasised the role of large-celled taxa. In Colfiorito, total biovolume frequently exceeded 2 × 10⁴ mm³ m⁻², with major contributions from diatoms and cyanobacteria (e.g. Heterokontophyta ≈ 2.6 × 10⁴ mm³ m⁻² and cyanobacteria ≈ 1.3 × 10⁴ mm³ m⁻² in 2015, and diatoms > 2.2 × 10⁴ mm³ m⁻² in 2018). Corbara exhibited the strongest biomass events, with dinoflagellates reaching about 3.1 × 10⁵ mm³ m⁻² in 2018 and additional peaks > 5 × 10⁴ mm³ m⁻² from diatoms and cyanobacteria in several years (2017–2020). In Piediluco and Trasimeno, biovolume maxima generally fell in the range 1–3 × 10⁴ mm³ m⁻², mostly associated with diatoms, cryptophytes and cyanobacteria. Aia, Arezzo and San Liberato showed comparatively moderate biovolumes, dominated by diatoms and cryptophytes with only occasional cyanobacterial contributions. Overall, lakes experiencing recurrent cyanobacterial blooms (Colfiorito, Corbara, Trasimeno) sustained both the highest cell densities and the largest biomass, whereas the remaining systems were characterised by more moderate, diatom–cryptophyte dominated communities.


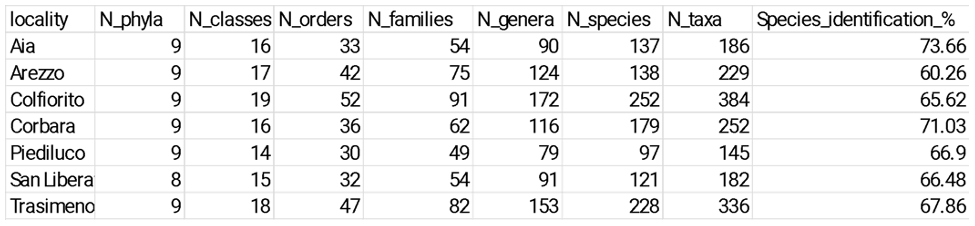
Table 1. Comparative phytoplankton taxonomic metrics across lakes.
Temporal trends and Taxonomic Diversity patterns across Umbrian lakes
Over time, taxonomic richness declined significantly in several lakes (Figure 2a). The strongest decreases were observed in Aia (−3.59 taxa yr⁻¹, p < 0.001, R² = 0.67), Piediluco (−2.03 taxa yr⁻¹, p < 0.001, R² = 0.62), San Liberato (−2.57 taxa yr⁻¹, p = 0.015, R² = 0.43), and Corbara (−2.68 taxa yr⁻¹, p = 0.033, R² = 0.33).
In contrast, Trasimeno showed a non-significant decline (−1.53 taxa yr⁻¹, p = 0.23), suggesting weaker directional pressure on community richness. Shannon diversity exhibited greater temporal stability (Figure 2b). Most lakes showed no significant trends, indicating that proportional abundances remained relatively stable despite reductions in species counts. Only Piediluco displayed a marked decline in Shannon index (−0.051 yr⁻¹, p = 0.0048, R² = 0.50), reflecting both richness loss and restructuring of relative biomass contributions. By contrast, Trasimeno showed a small, non-significant increase in Shannon diversity (+0.035 yr⁻¹), implying that moderate richness decline did not translate into reduced evenness or overall diversity.


Figure 2. Temporal trend of a) Taxonomic Richness b) Shannon diversity for each lake.
Temporal trends and Functional Diversity patterns across Umbrian lakes
In contrast to the taxonomic signal, functional diversity showed minimal directional change in most lakes (Figure 3a). Trends in Rao’s quadratic entropy (RaoQ) and functional dispersion (FDis) were weak and statistically non-significant for nearly all systems. Slopes were close to zero, and p-values were consistently > 0.1, indicating an absence of strong temporal restructuring of functional trait space. The only exception was Trasimeno, which exhibited a significant positive trend in functional diversity (RaoQ: +0.0113 yr⁻¹, p = 0.016; FDis: +0.0493 yr⁻¹, p = 0.021), suggesting a long-term broadening of functional strategies within the community. This result contrasts with its modest loss of richness, implying compensatory replacement by functionally dissimilar taxa. Functional redundancy, defined as scaled richness minus scaled RaoQ, declined moderately in several lakes, though again rarely significantly. The strongest decrease occurred in Trasimeno (−0.0684 yr⁻¹, p = 0.011), suggesting a gradual reduction in the number of species that share similar functional roles. Aia (−0.0608 yr⁻¹, p = 0.076) and Piediluco (−0.0385 yr⁻¹, p = 0.079) showed borderline declines, indicating increasing sensitivity of their functional structure to species loss.
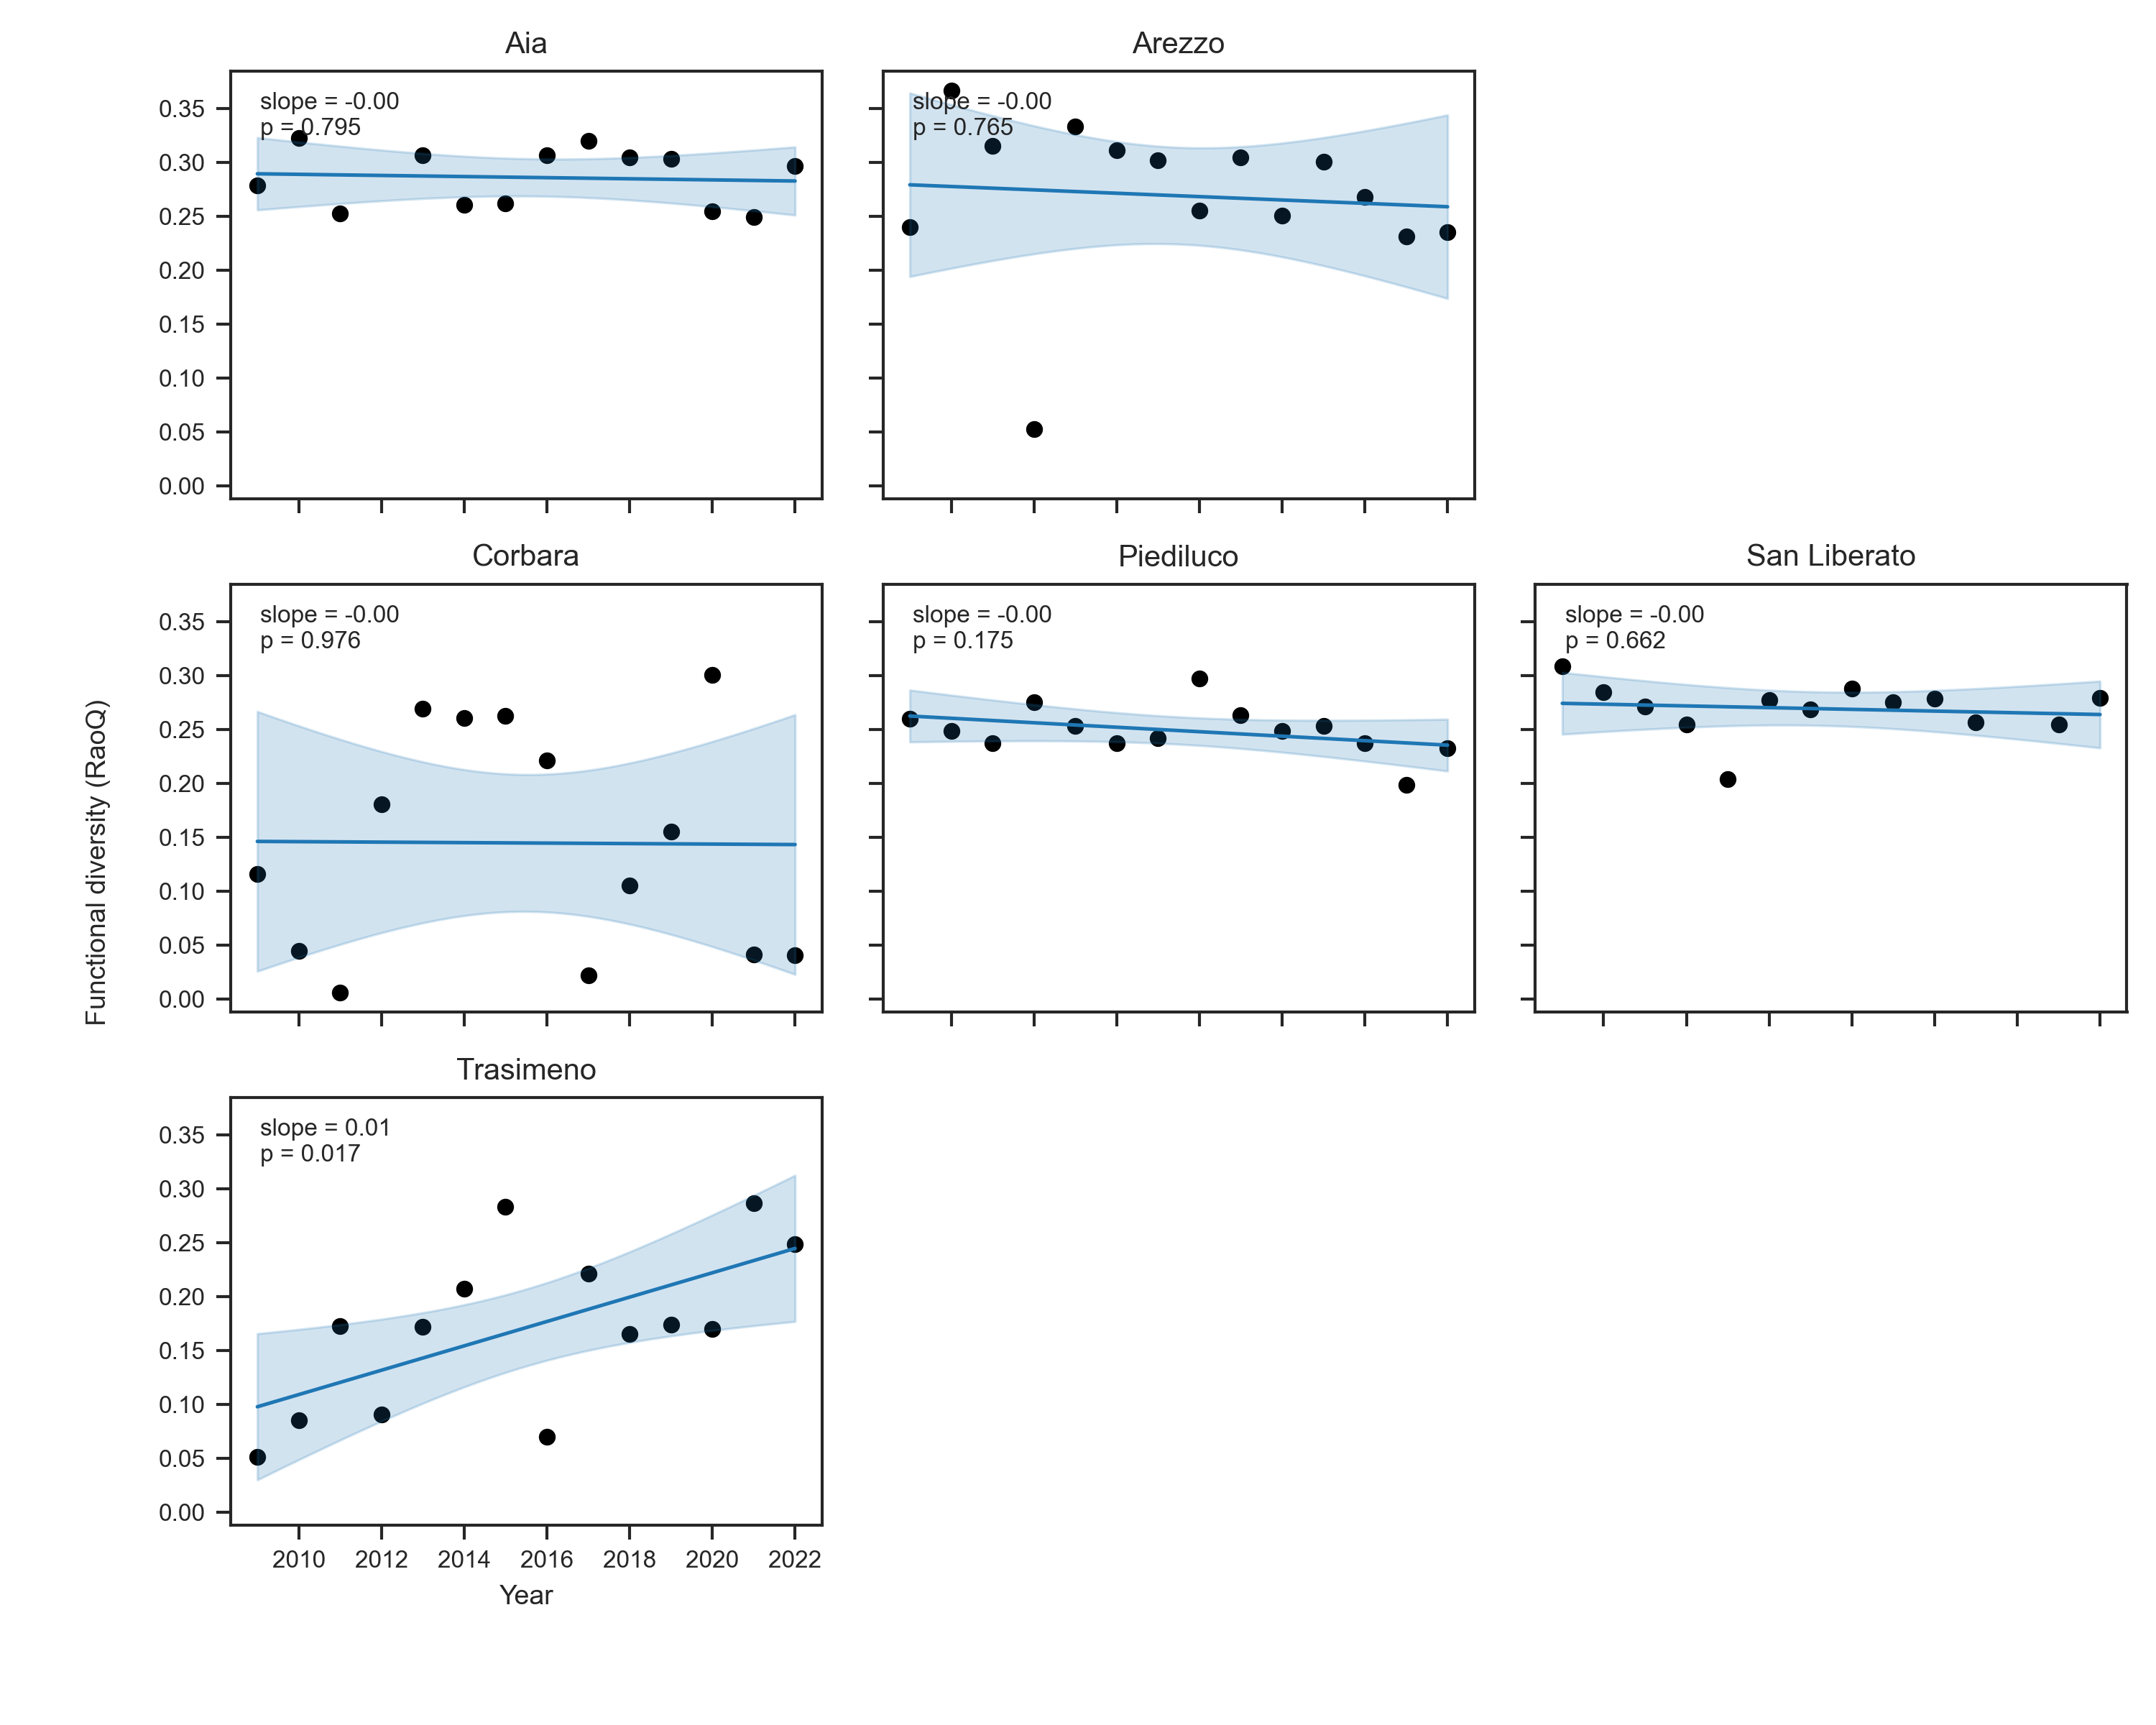

Figure 2. Temporal trend of a) Functional diversity b) Functional redundancy for each lake over time.
Environmental controls on phytoplankton functional structure
Correlations between environmental variables and functional metrics were generally weak across lakes, but a few systems, most notably Trasimeno, showed consistent signals. The large majority of relationships showed low effect sizes and high p-values, indicating that environmental variability does not strongly predict functional diversity shifts in most systems. Lake Trasimeno was the only system where functional diversity, dispersion and redundancy all exhibited significant temporal trends and coherent relationships with abiotic drivers (Figure 3). For both RaoQ and FDis, higher nutrient concentrations were associated with lower functional diversity: total phosphorus, total nitrogen and orthophosphate were negatively correlated with RaoQ (r ≈ −0.61 to −0.53, p ≈ 0.02–0.05) and with FDis (r ≈ −0.60 to −0.57, p ≈ 0.02–0.03). In contrast, functional redundancy increased with nutrient availability, especially orthophosphate (r ≈ 0.66, p ≈ 0.01) and, to a lesser extent, total nitrogen and nitrate (r ≈ 0.48–0.47, p ≈ 0.08–0.09). Alkalinity and water temperature also played a role: they were positively related to FDis and RaoQ (e.g. alkalinity–RaoQ r ≈ 0.54, p ≈ 0.05; water temperature–FDis r ≈ 0.55, p ≈ 0.04), but negatively or weakly related to redundancy. Taken together, these patterns indicate that in Trasimeno long-term eutrophication and associated changes in water chemistry have promoted a loss of functional diversity and an increase in functional redundancy, consistent with the taxonomic trends already observed, while in the other lakes functional structure appears either more weakly constrained by the measured environmental variables or dominated by seasonal rather than directional drivers.

Functional Clusters in lake Trasimeno
The k-prototypes algorithm identified four functional clusters (A–D) within the Trasimeno phytoplankton community (Figure 5a,b). Cluster B was dominated by Chlorophyceae and Cyanophyceae, characterised by motile or colonial forms and, for cyanobacteria, potential toxin production; these traits, together with warm and nutrient-rich conditions, clearly separated this group. Cluster C was defined by Bacillariophyceae, whose non-motile, siliceous and non-toxic forms aligned with the cooler and oxygen-rich conditions typical of this cluster. Clusters A and D showed more heterogeneous compositions, comprising various green algae, cryptophytes and dinoflagellates; their separation reflected subtle differences in motility, life-form and cell morphology rather than a single dominant functional trait. Environmental conditions differed strongly among clusters (Figure 5b). Kruskal–Wallis tests were significant for all variables (temperature, transparency, total P, total N, alkalinity, ammonium, dissolved oxygen and phytoplankton density). Dunn’s post-hoc tests confirmed widespread pairwise differences, particularly for temperature, transparency and nutrients. Ammonium sharply distinguished cluster B, while dissolved oxygen distinguished cluster C. Phytoplankton density varied less markedly, with only one significant contrast (B vs C). Overall, the Trasimeno clusters represent distinct functional and taxonomic assemblages associated with well-defined environmental gradients, especially those related to temperature, water clarity, nutrient availability and oxygen conditions.

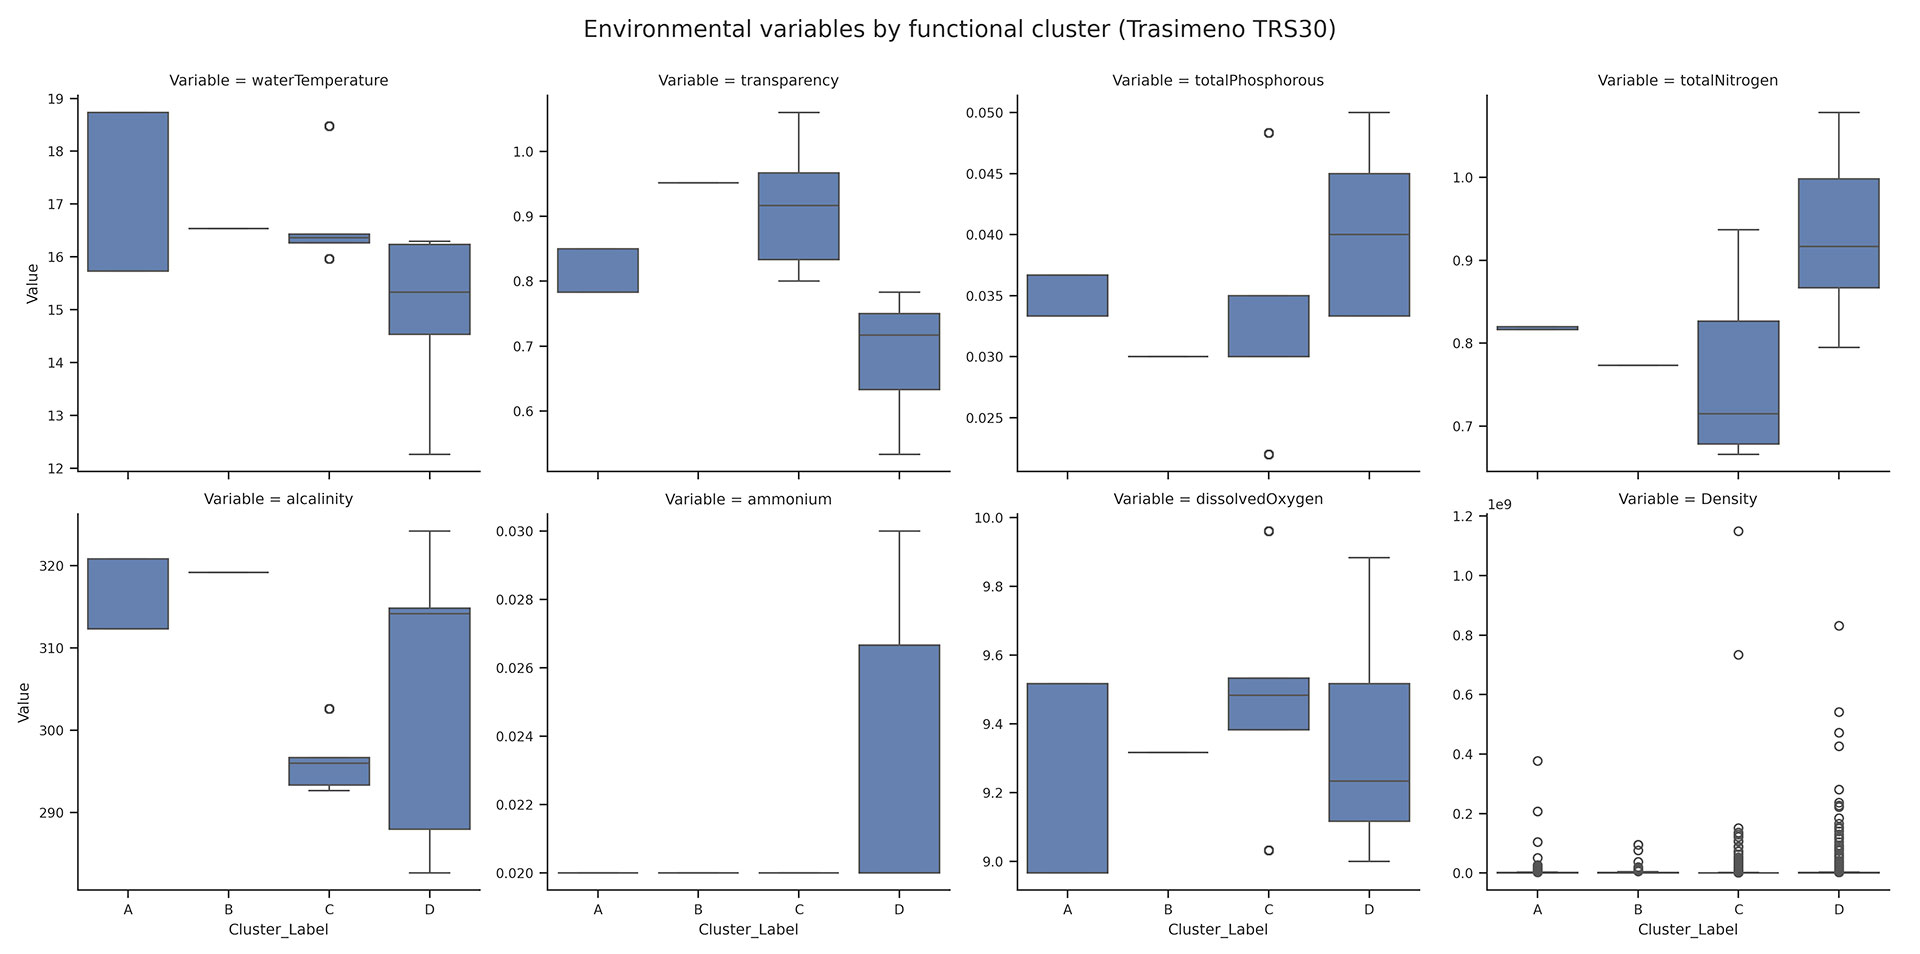
Figure 5 a). Sankey diagram showing the correspondence between major phytoplankton taxonomic classes and the four functional clusters (A–D) identified by the k-prototypes algorithm. b) Boxplots of key environmental variables across the four functional clusters (A–D) in lake Trasimeno.
Technical notes
This workflow provides a reproducible framework that integrates classical and functional diversity metrics with environmental information to analyse long-term structural dynamics in phytoplankton communities. By transforming biological and environmental datasets into analysis-ready formats, and by generating diagnostic outputs such as traditional and functional diversity indices, linear regressions, correlation matrices and heatmaps, the workflow establishes a robust foundation for multivariate analyses, functional-trait assessments and ecological modelling in lake ecosystems. When required, the workflow can also be extended to incorporate remote-sensing products. Furthermore, it can be coupled with the predictive tools implemented in Workflow 6, enabling scenario projections and enhancing our understanding of biodiversity patterns and functional organisation in aquatic ecosystems under changing environmental conditions.