Use case WF 1
Influence of environmental management actions and seasonal dynamics on phytoplankton in the Ria d’Aveiro lagoon
Phytoplankton communities are key components of coastal lagoon ecosystems, where they contribute substantially to primary productivity and respond rapidly to environmental fluctuations. Owing to their short generation times and strong dependence on hydrological and nutrient conditions, phytoplankton assemblages are widely recognized as effective bioindicators for assessing ecological quality in transitional waters. The Ria d’Aveiro, a shallow coastal lagoon on the northwestern coast of Portugal, includes areas with different environmental conditions and management regimes, ranging from strongly human-impacted zones to protected areas and sites where recent restoration actions have taken place. Seasonality represents an additional major driver of phytoplankton dynamics. Understanding how management interventions interact with natural seasonal variability can offer insights into ecosystem functioning, resilience, and the effectiveness of restoration measures. This study aims to characterize phytoplankton community composition, size structure, and diversity across the three management contexts: Altered, Protected, and Restored, and to evaluate how these patterns vary with seasonal conditions.
Dataset used: Phytoplankton counts in the coastal wetland area of Ria de Aveiro in different ecological states
The Ria d’Aveiro lagoon dataset comprises phytoplankton samples collected at multiple sites across the lagoon throughout the four seasons. It includes raw cell counts, detailed counting procedures, and a range of morphological measurements (e.g., cell length, width, and thickness), as well as geometric shape descriptors. Taxonomic information is provided from kingdom to species level. Each sample is accompanied by comprehensive metadata describing the management treatment (Altered, Protected, or Restored), replicate, sampling event, locality with geographic coordinates, and temporal information (season, month, day, and year). This structure enables robust comparisons of phytoplankton assemblages across management treatments and seasonal gradients. Additional details about the dataset used in this use case are publicly available through the LifeWatch Italy metadata catalogue at the following link: https://metadatacatalogue.lifewatchitaly.eu/geonetwork/srv/eng/catalog.search#/metadata/96619c84-60f6-4184-adf5-16aca2741b05.
Methods
Given the objectives of this case study, Workflow 1 was adapted, and only the web services required for the analysis were selected. The trait-computation service, the size-class distribution service, and the services for generating the community matrix and diversity indices were used. Raw phytoplankton cell counts were first converted into demographic traits through the computation of trait density, after which biovolume, carbon content, biomass, and their totals (total carbon content, total biomass, total biovolume) were derived. Size-class distributions were then generated for each season and management treatment by expressing carbon content on a log₂ scale and assigning organisms to integer size classes; all classes above 14 were aggregated to avoid sparsity. For every season x treatment x size class combination, species-level densities were summed and expressed as percentages of the class total, producing both a complete contribution table and a reduced table retaining the top five contributing species. To quantify size spectra, binned densities from log₂ classes 1–14 were used to fit separate regressions of log₁₀(density) against log₂ (size class) for each season–treatment group. Only classes with positive density were included. Slopes, intercepts, R² and p-values were extracted, and skewness and kurtosis were computed to characterise the shape of each distribution. Slope values were then analysed using ANOVA, with season and treatment as categorical predictors, to assess the main drivers of variation in phytoplankton size structure. To further characterise differences among treatments and seasons, community-level multivariate analyses were performed. Bray–Curtis dissimilarity matrices were computed from square-root–transformed densities and used to generate hierarchical cluster dendrograms at both treatment level and treatment–season level. Expected richness was additionally compared among treatments through individual-based rarefaction curves. Differences in community composition were tested using PERMANOVA with 999 permutations, followed by pairwise contrasts, while the homogeneity of multivariate dispersion was assessed through PERMDISP to ensure that PERMANOVA outcomes were not driven by unequal within-group variance. Individual-based rarefaction curves were generated for each management treatment to assess differences in expected richness while standardizing for sampling effort. Mean rarefaction profiles were computed using repeated random subsampling without replacement, allowing a direct comparison of the richness–accumulation patterns among Altered, Protected, and Restored sites. Diversity indices were also calculated for each sample and subsequently summarised across seasons and management treatments. For inferential statistics and figures, we focused on richness (R), Shannon diversity (H) and Pielou evenness (J). Differences in R, H and J among treatments and seasons were tested with a two-way ANOVA with fixed factors treatment (3 levels) and season (4 levels) and their interaction. Model assumptions were checked via Shapiro–Wilk tests on model residuals and Levene’s tests for homogeneity of variance, and Tukey’s HSD was applied for post-hoc comparisons when a main effect was significant.
Results
Phytoplankton size structure
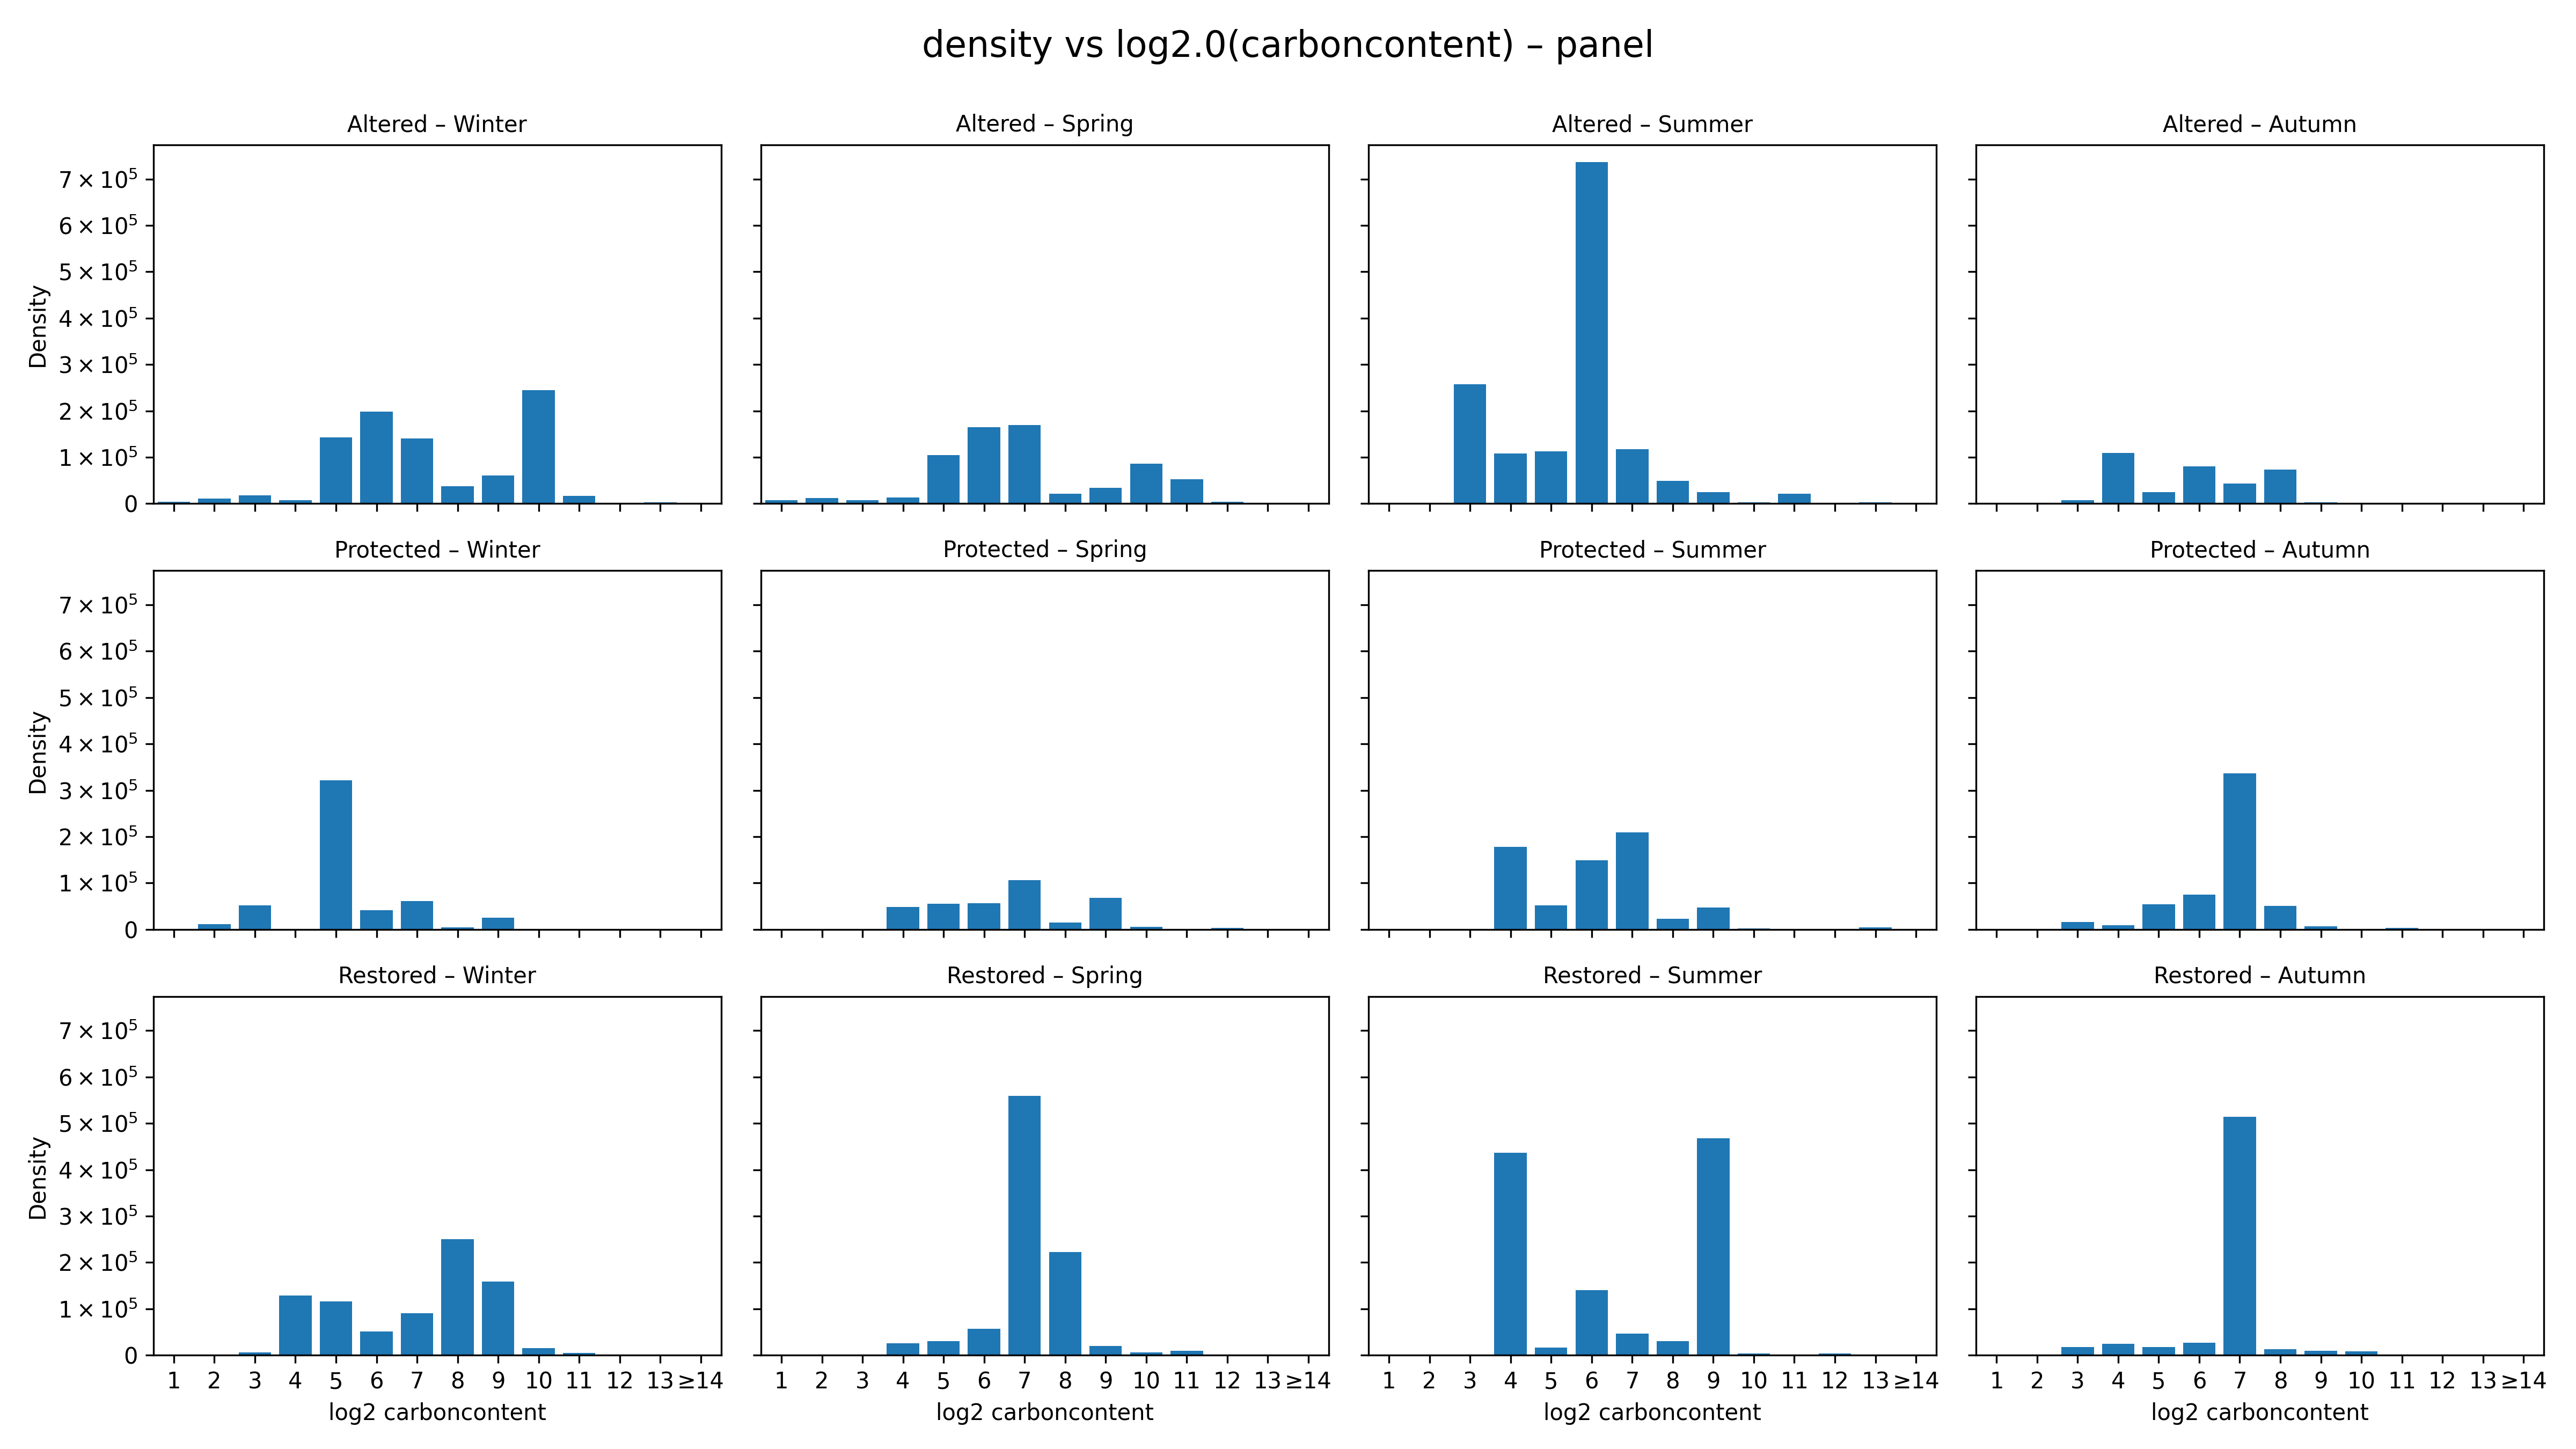
Phytoplankton size structure varied markedly across seasons and management treatments (Figure 1). Most communities were dominated by intermediate log₂ size classes (6–8), but the sharpness and shape of the distributions differed substantially. Altered sites showed broad, weakly structured and generally platykurtic spectra, whereas Protected and Restored sites displayed sharp, leptokurtic patterns typical of size-selective communities. Seasonality was the strongest driver of size structure (Figure 2; Table 1). Summer assemblages exhibited the steepest negative slopes, particularly in Restored (–0.24) and Altered sites (–0.23), reflecting dominance of small diatoms such as Thalassiosira minima, Skeletonema costatum, and Leptocylindrus. Winter size spectra were nearly flat (–0.03 to –0.13), indicating low size-selective structuring. Autumn showed the clearest treatment differences: Altered sites had a positive slope (+0.10) driven by large centric diatoms (Coscinodiscus, Rhizosolenia), while Protected and Restored sites displayed highly leptokurtic distributions (kurtosis 11–13) dominated by medium-sized chain-forming diatoms, including Chaetoceros socialis, Thalassiosira rotula, and Skeletonema costatum. Distribution-shape metrics were consistent with these visual patterns: Protected and Restored sites were predominantly leptokurtic, while Altered sites remained flatter and less selective.
Spring communities showed intermediate patterns, with mixed contributions from Leptocylindrus danicus, Cocconeis, Navicula, Thalassiosira minima, and chain-forming diatoms; Restored–Spring had the strongest right-skewness (approximately 4). Distribution-shape metrics supported these visual patterns: Protected and Restored sites consistently exhibited leptokurtic, size-selective spectra, whereas Altered sites remained platykurtic and weakly structured. ANOVA confirmed that season was the principal driver of size-spectrum variability, with treatment effects most evident in Autumn. Overall, Protected and Restored sites supported structured, size-selective communities dominated by medium-sized diatoms, while Altered sites showed flatter, low-selectivity spectra with greater contributions from large disturbance-tolerant taxa.
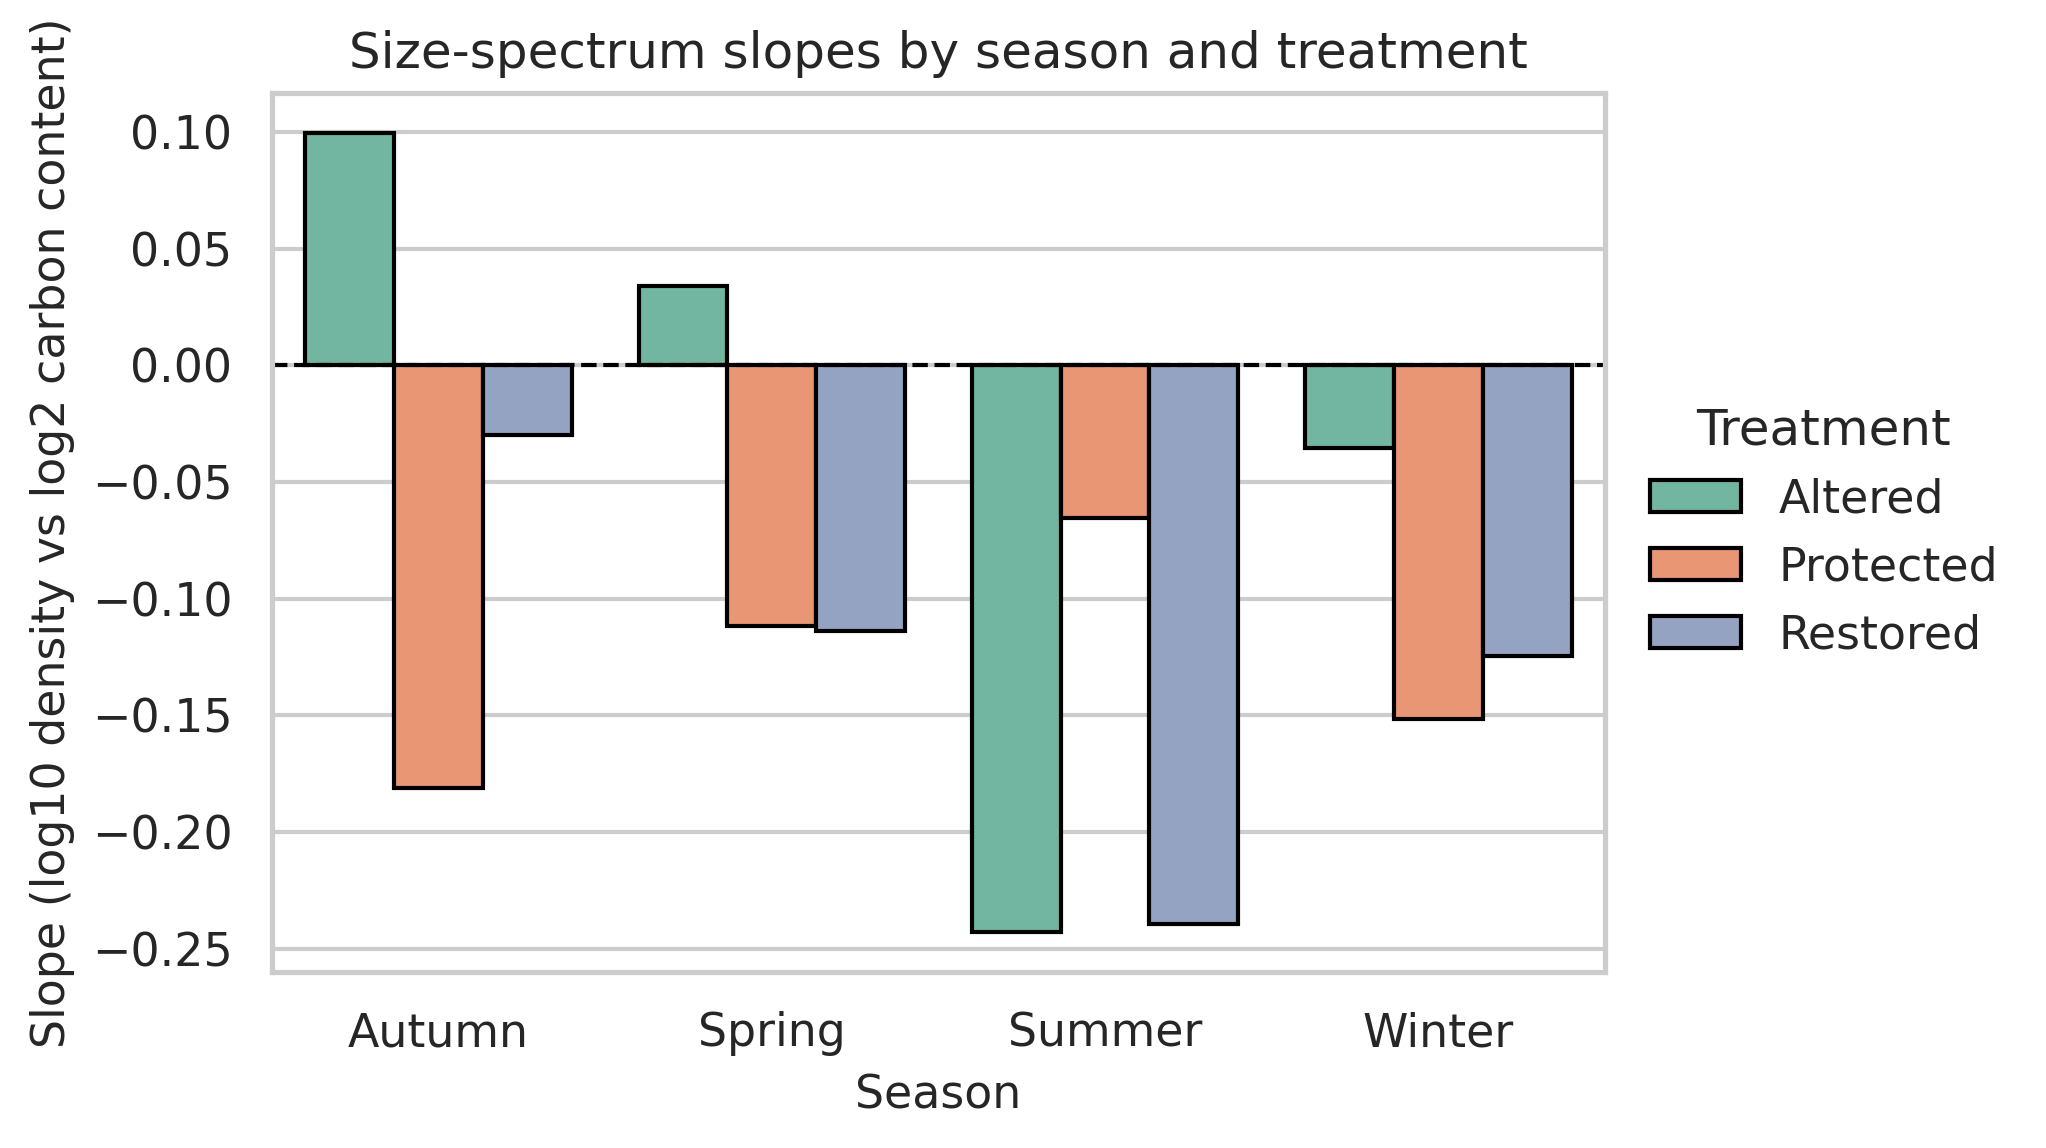
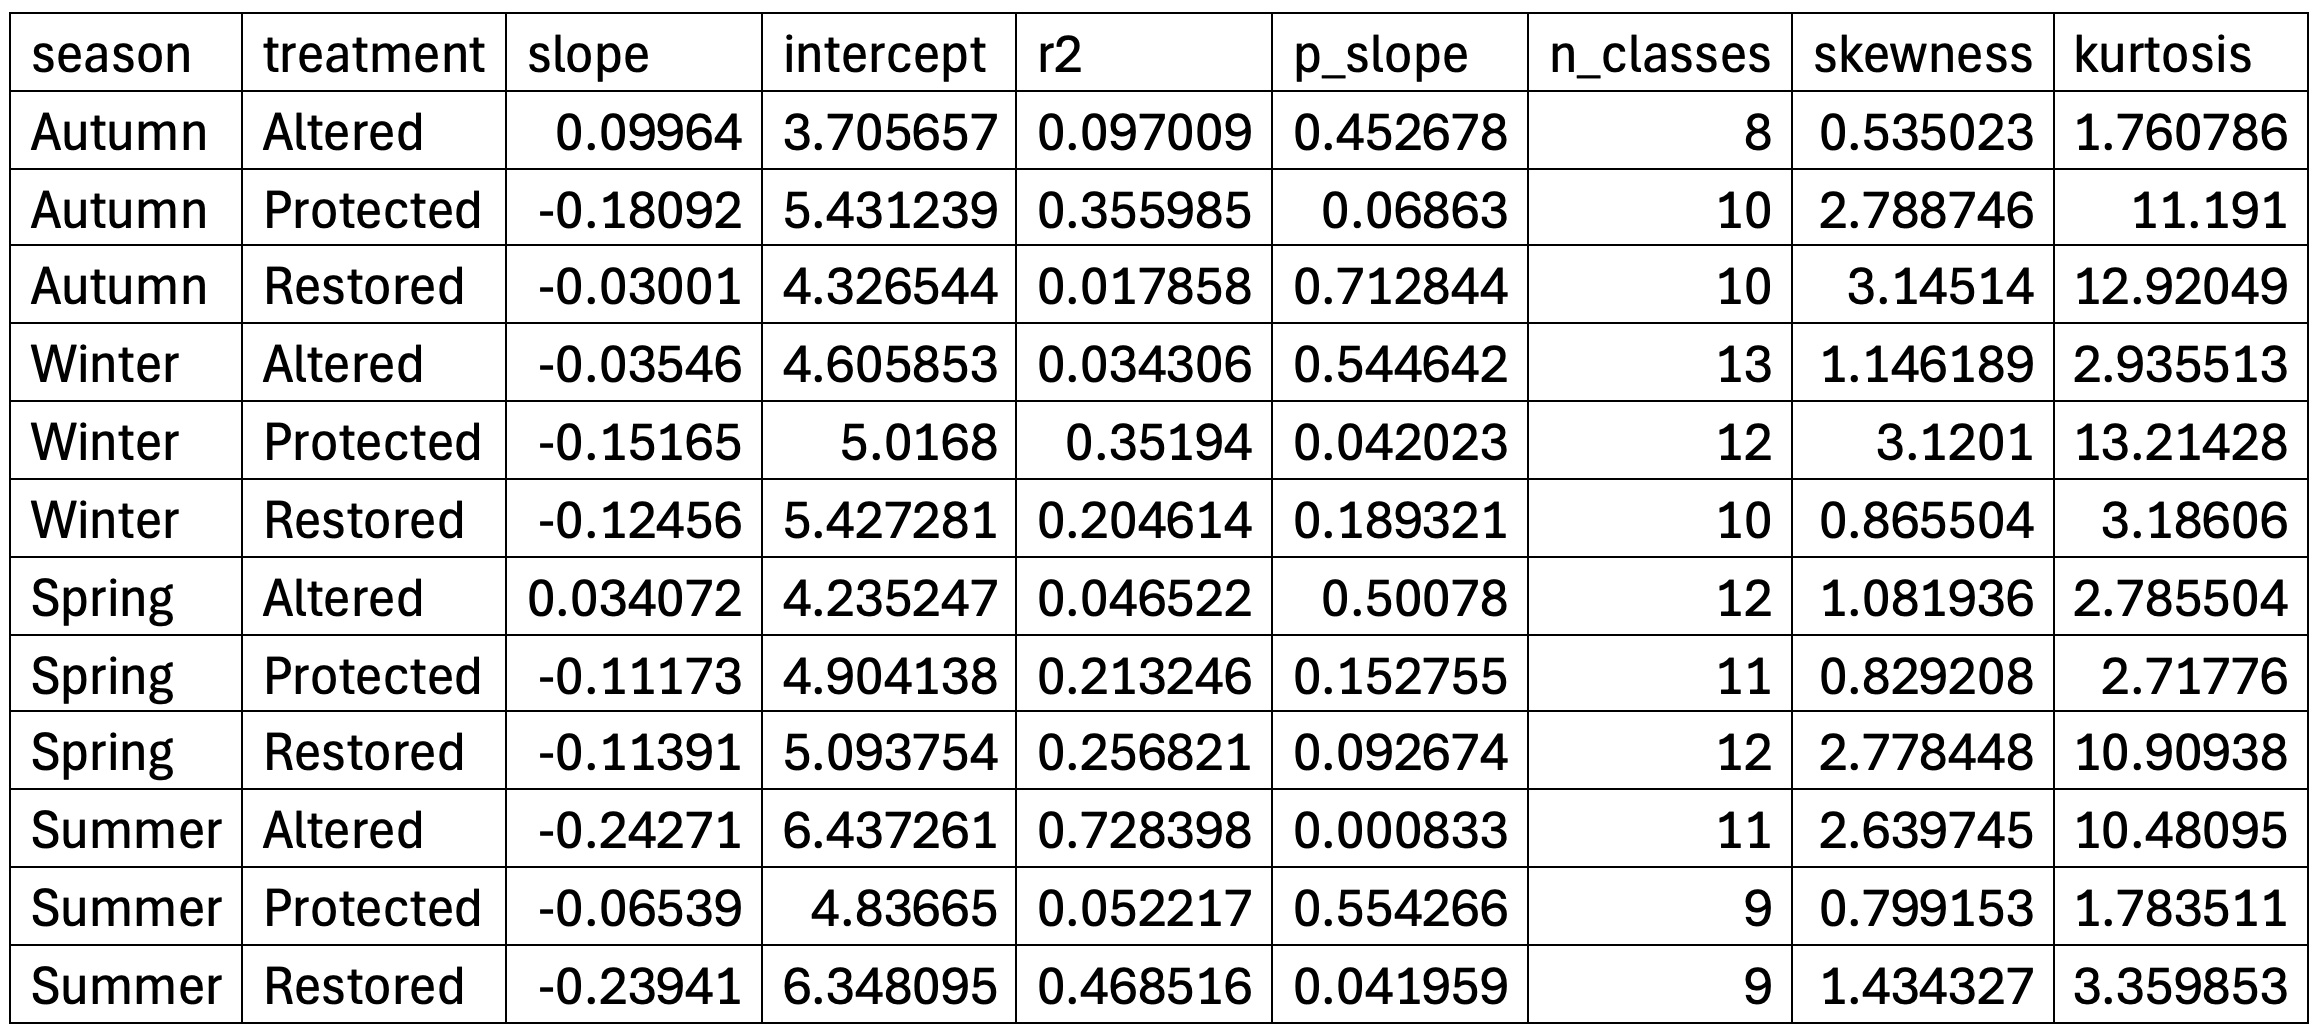
Table 1. Summary of regression slope and intercept, coefficient of determination (R²), significance of the slope (p), number of size bins used, skewness, and kurtosis calculated from the original density distributions. Kurtosis values >3 indicate leptokurtic (peaked) distributions, while values <3 indicate platykurtic (flatter) distributions.
Community composition and diversity
Hierarchical clustering based on Bray–Curtis dissimilarity showed a clear tendency for Restored sites to separate from the Altered and Protected ones, which instead clustered more closely together (Figure 3). When the seasonal dimension was included, samples remained generally grouped according to treatment, with only weak secondary structuring by season. Rarefaction curves further indicated comparable asymptotic richness across treatments, although Protected sites exhibited a slightly lower expected richness compared to Altered and Restored areas. However, these visual trends were not supported by statistical tests. PERMANOVA indicated no significant differences in community composition among treatments (F = 0.016, p = 0.816) or seasons (F = 0.066, p = 0.314), and pairwise PERMANOVA comparisons confirmed the absence of significant contrasts (all p > 0.48). Multivariate dispersion was also homogeneous among treatments and seasons (PERMDISP p > 0.72), excluding differences in within-group variability.
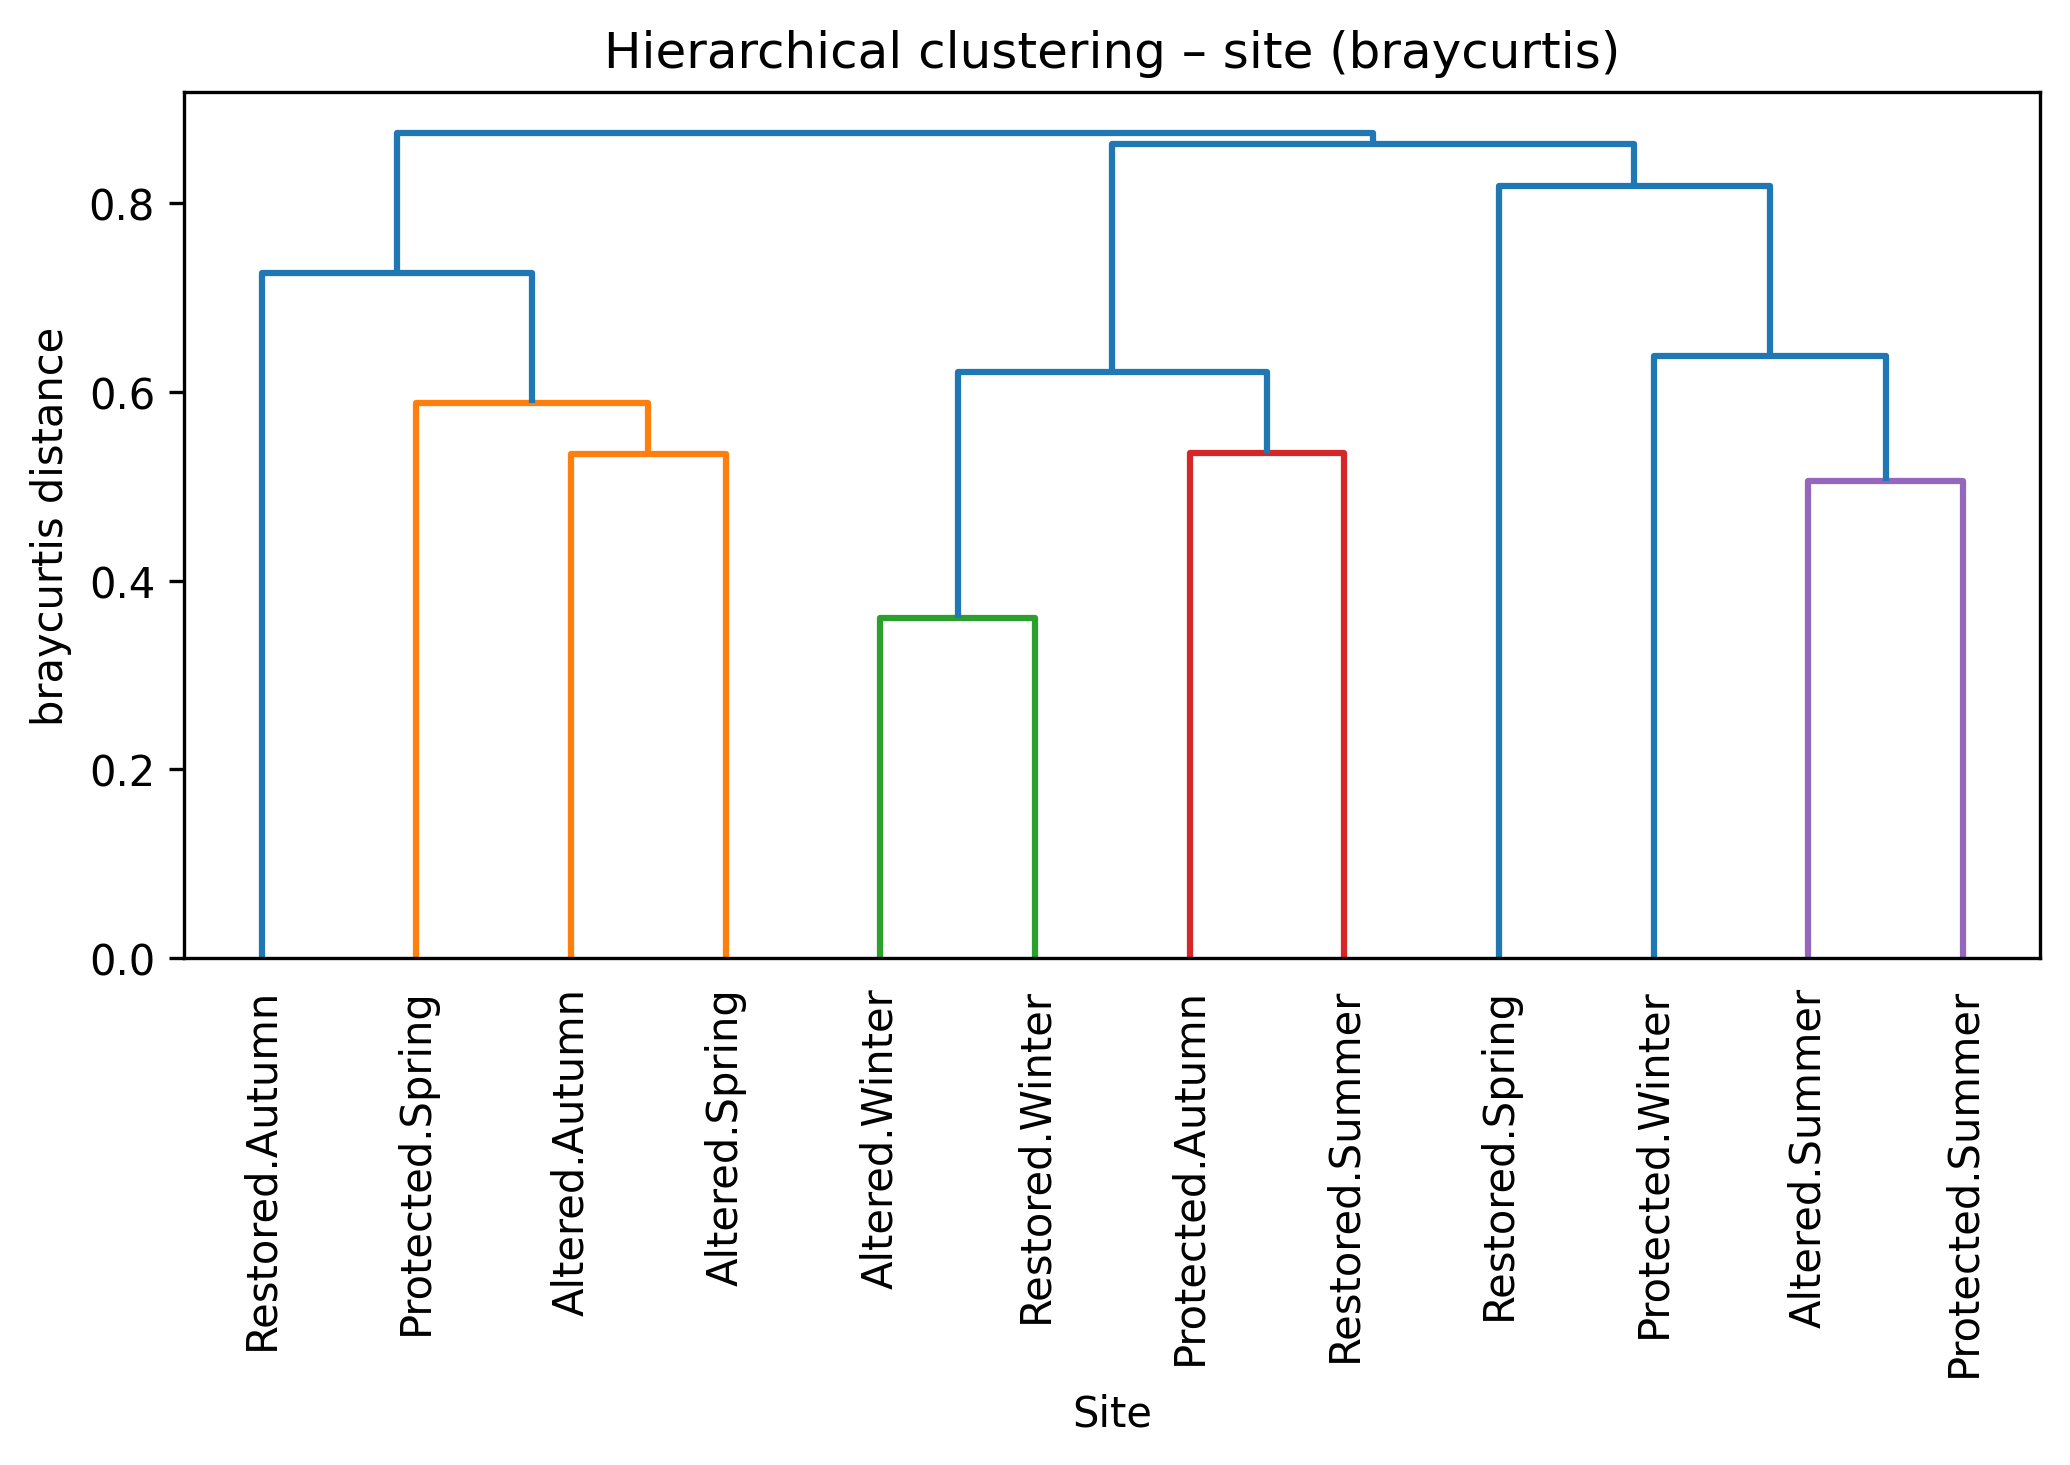
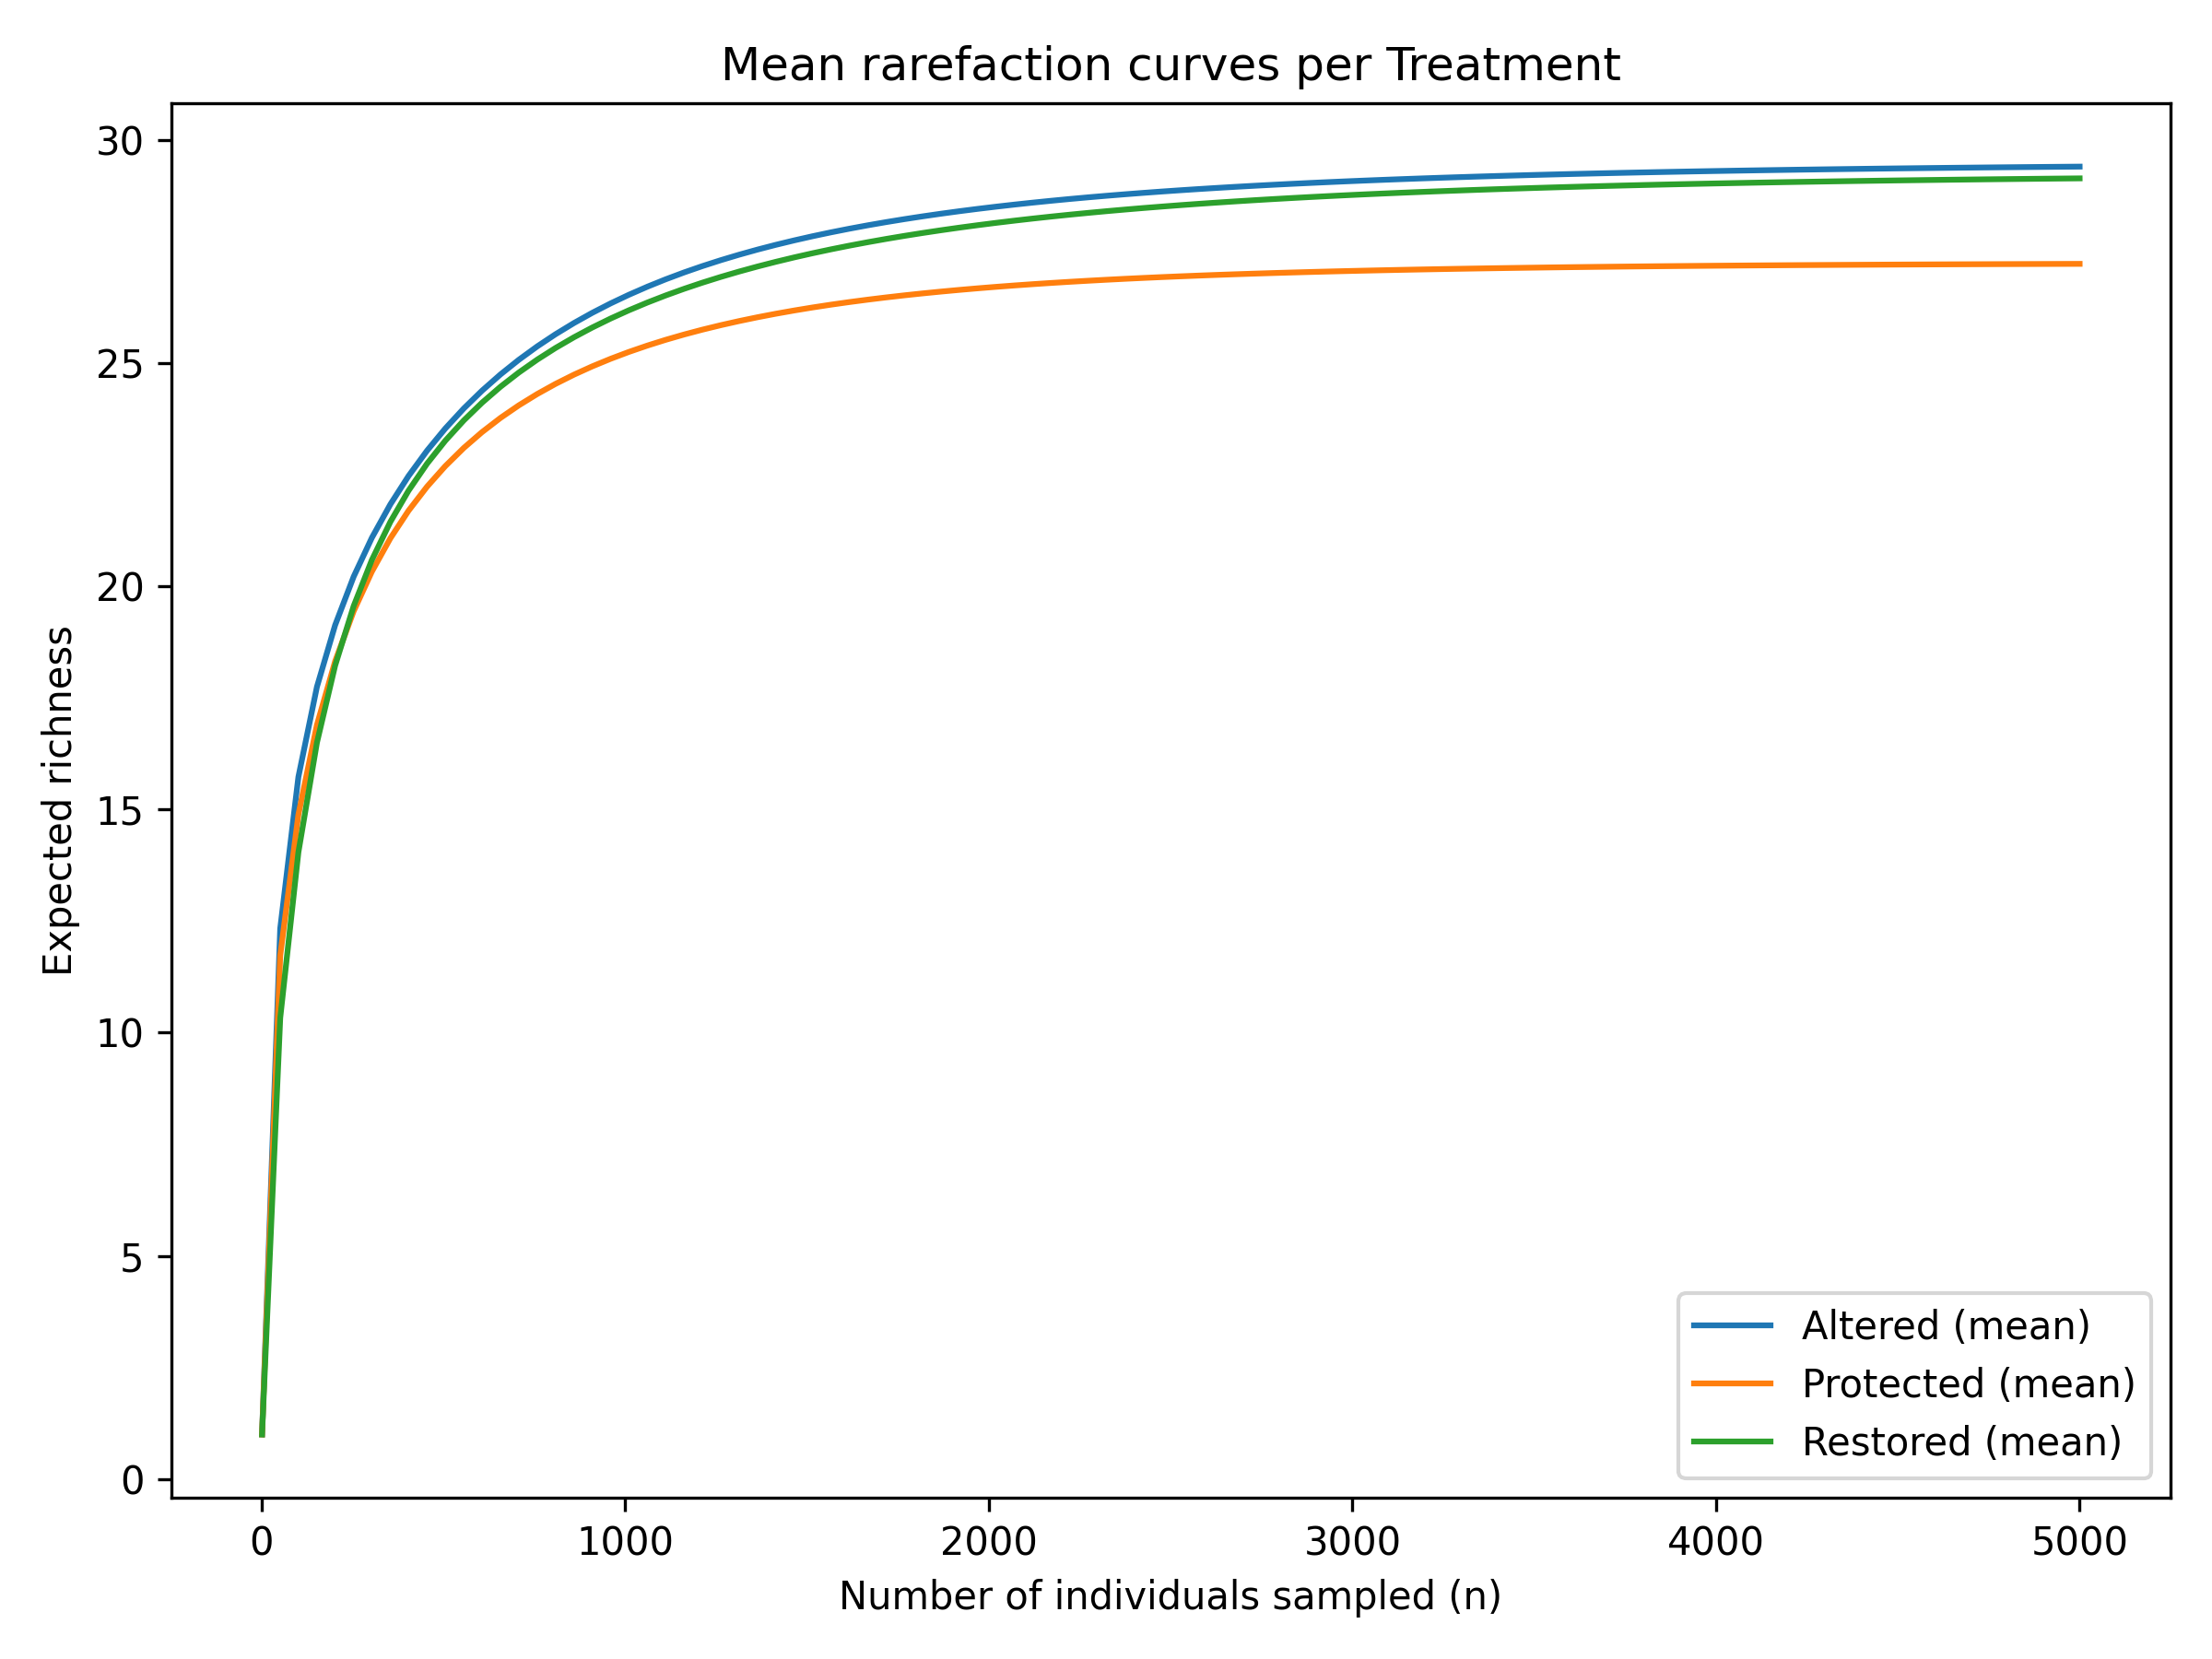
Figure 3. Hierarchical clustering based on Bray–Curtis dissimilarity and mean individual-based rarefaction curves showing expected richness as a function of sampled individuals for Altered, Protected and Restored treatments.
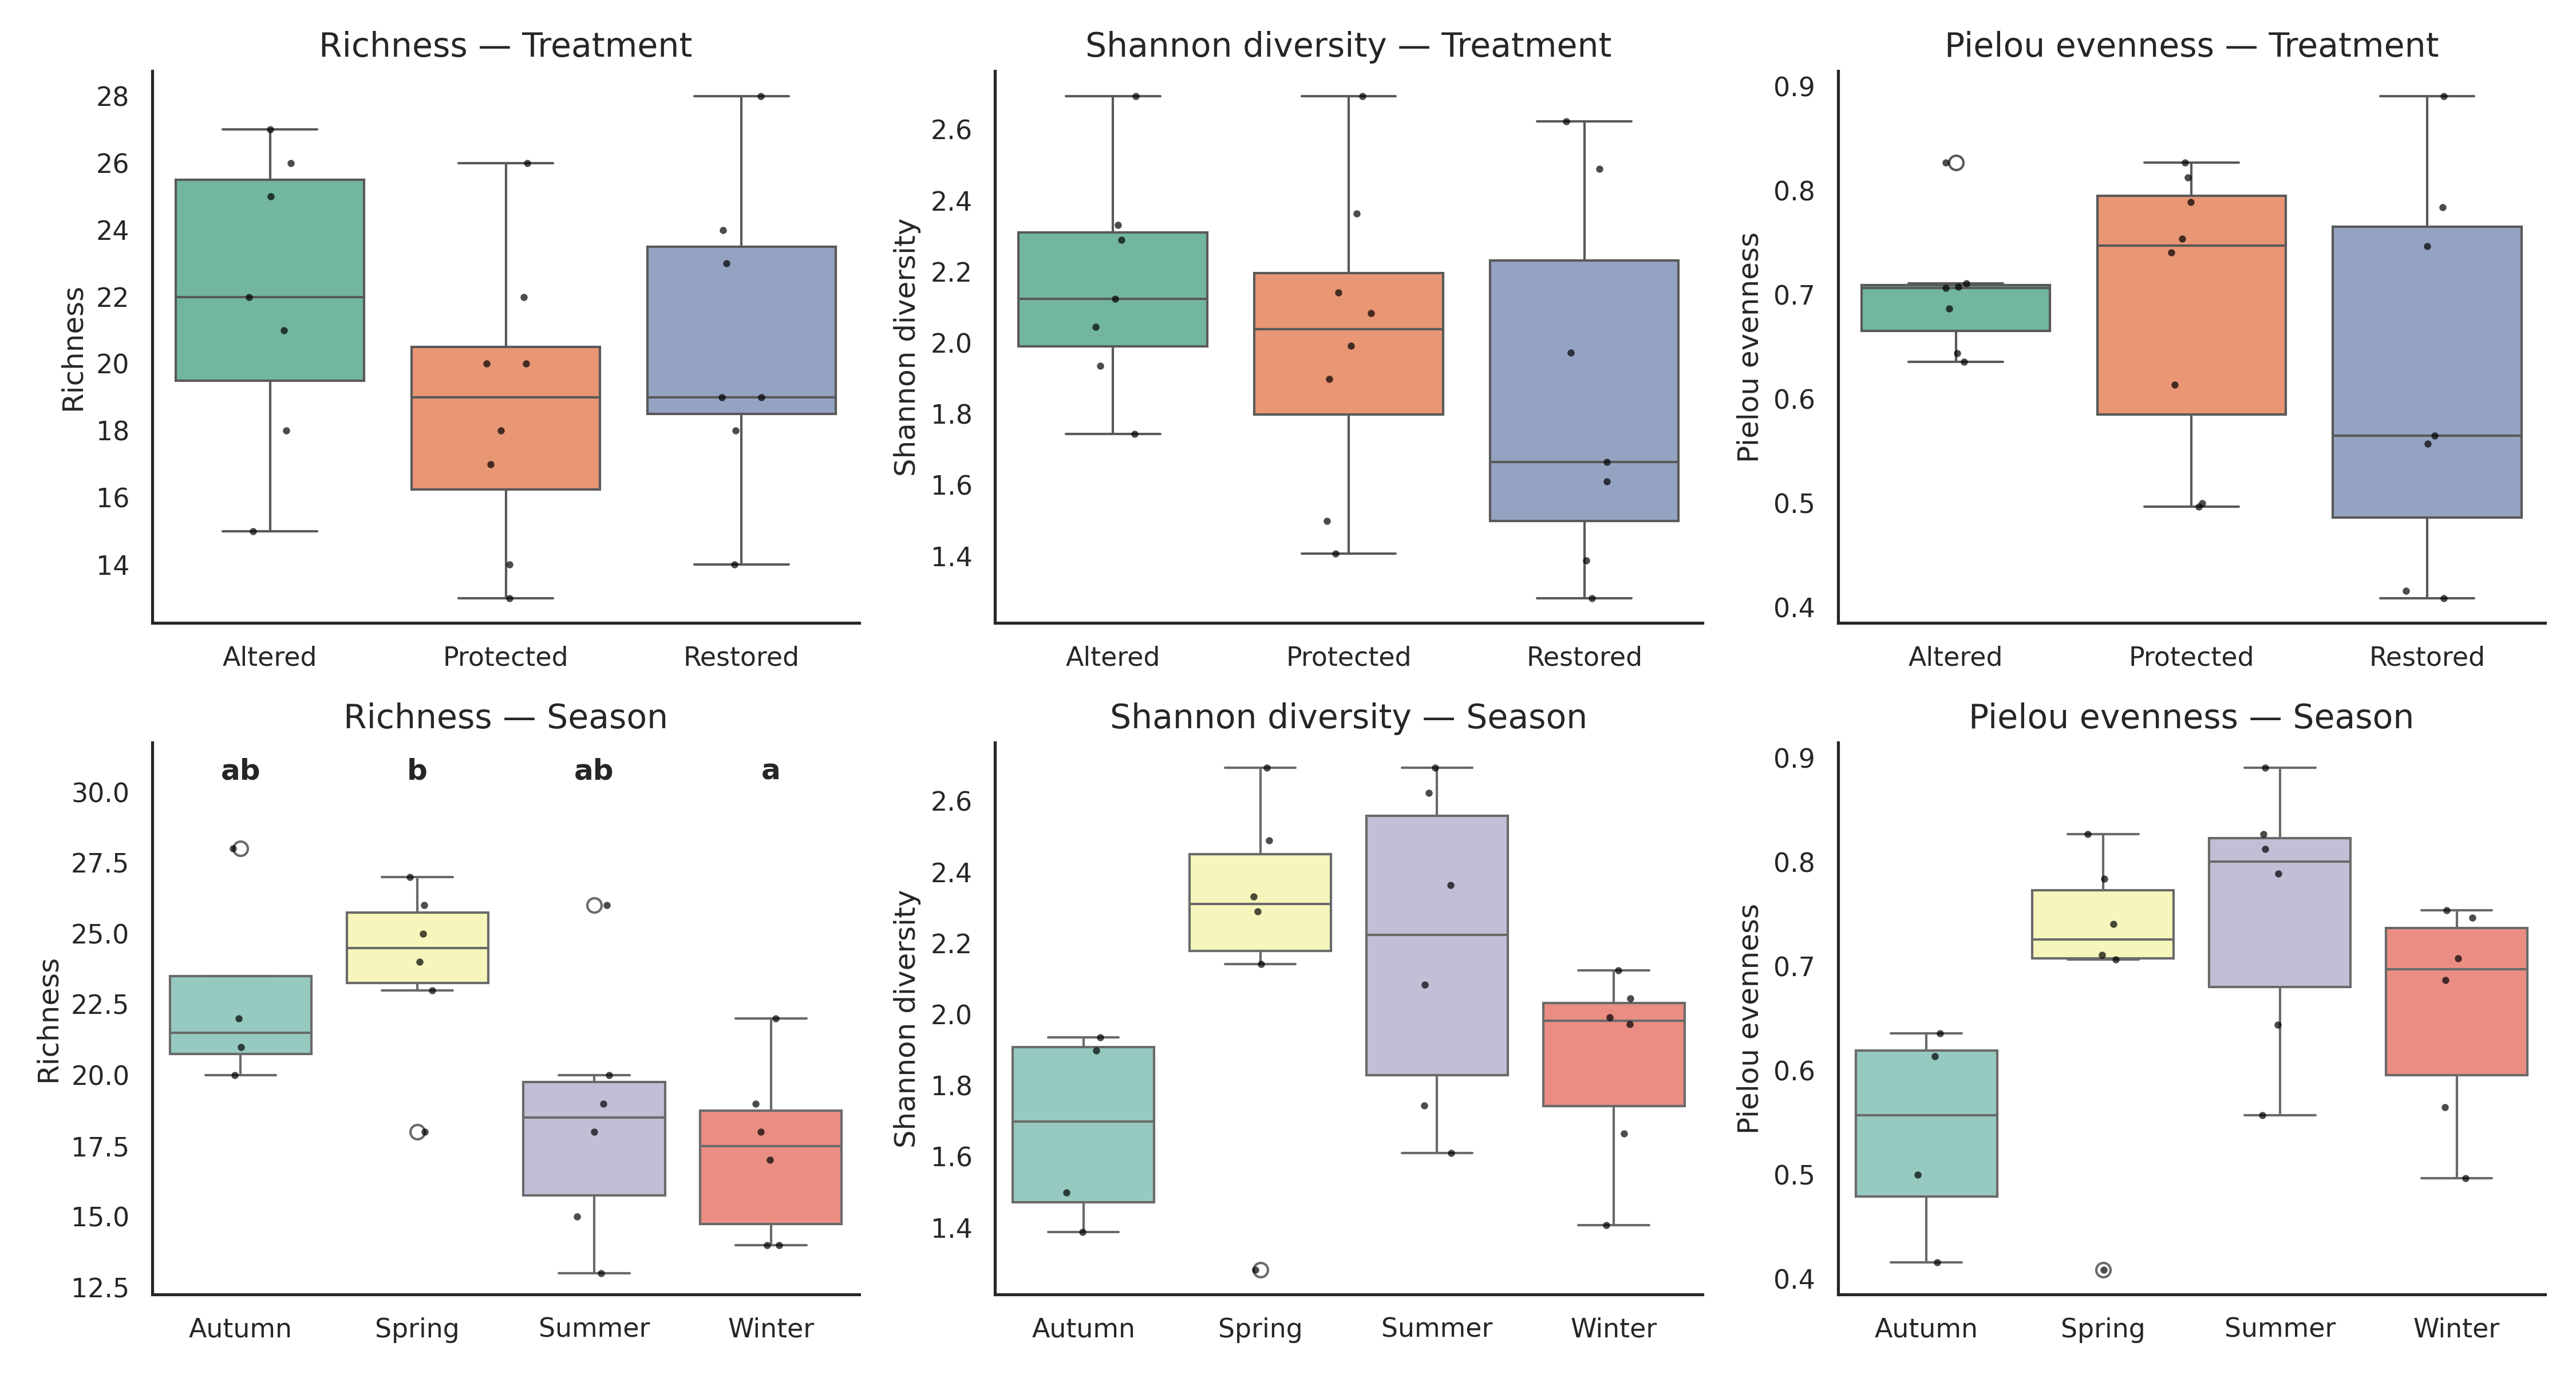
Tukey HSD revealed that richness was significantly higher in winter than in spring (p = 0.029), while all other contrasts were non-significant. Shannon diversity (H′) and Pielou’s evenness (J′) showed no significant effects of treatment (H′ p = 0.493; J′ p = 0.476), season (H′ p = 0.276; J′ p = 0.185), or interaction. Post-hoc tests confirmed the absence of significant pairwise differences.
Technical notes
Although only a subset of these services and parameters was used in this case study, Workflow 1 provides a modular and highly flexible framework for processing phytoplankton trait data and performing size-based and taxonomic community analyses. Each component can be fully adjusted by the user. Inputs such as the taxonomic resolution, trait formulae, transformation methods, grouping factors, thresholds for size-class aggregation, and the choice of diversity or dissimilarity metrics can be customised according to dataset structure or research goals.