Use case WF 4
Role of Rare Species on Phytoplankton Size Density Relationships across Different Biogeographical Areas
Phytoplankton guilds are typically characterised by strong dominance effects, as a small number of abundant taxa contribute most of the total biomass and productivity. In contrast, the largest share of biological diversity is supported by rare and occasional species. The aim of this workflow and case study is to contribute to the understanding of the quantitative relevance and functional importance of species rarity in phytoplankton communities, by evaluating the role of rare taxa in shaping phytoplankton size–density relationships, morpho-functional diversity, and community assembly processes. To this end, we analyse size–density relationships in the context of Damuth’s law, which predicts a negative power-law scaling between body size and numerical abundance, with an expected slope of approximately –¾. This macroecological rule, originally formulated for terrestrial animal communities, has been increasingly investigated in aquatic ecosystems and microbial plankton, where its applicability remains debated. In this study, we test whether phytoplankton communities follow Damuth-like scaling and assess how the removal of rare species affects the slope and structure of these relationships at both global and regional scales. We explore these dynamics using phytoplankton communities from five biogeographical regions: the Northern Atlantic Ocean (Scotland), the South-Western Atlantic Ocean (Brazil), the South-Western Pacific Ocean (Australia), the Indo-Pacific Ocean (Maldives), and the Mediterranean Sea (Greece and Turkey). We compare size–density relationships and taxonomic diversity between the full dataset and progressively filtered datasets in which taxa contributing to the lowest 1%, 5%, 10%, and 25% of both cumulative density and biovolume were removed. This comparative approach allows us to quantify the contribution of rare species to community structure, size spectra, and deviations from theoretical scaling expectations.
Dataset used: An integrated individual-level trait-based phytoplankton dataset from transitional waters
The dataset integrates six phytoplankton datasets from 24 transitional water ecosystems across five biogeographical regions: Northern Atlantic Ocean (Scotland), South-Western Atlantic Ocean (Brazil), South-Western Pacific Ocean (Australia), Indo Pacific Ocean (Maldives) and Mediterranean Sea (Greece and Turkey). Phytoplankton samples were collected in a single sampling event that took place between July 2010 and November 2012, following a hierarchical sampling design (116 sites, ~350 samples). In total, 127311 phytoplankton individuals representing 306 taxa were counted, measured, and taxonomically classified. Data include sampling locations, taxonomic information, and cellular morphometric measurements, and it is openly available through the LifeWatch Italy Data Portal. For more information on the dataset please visit: https://www.nature.com/articles/s41597-023-02785-w
Methods
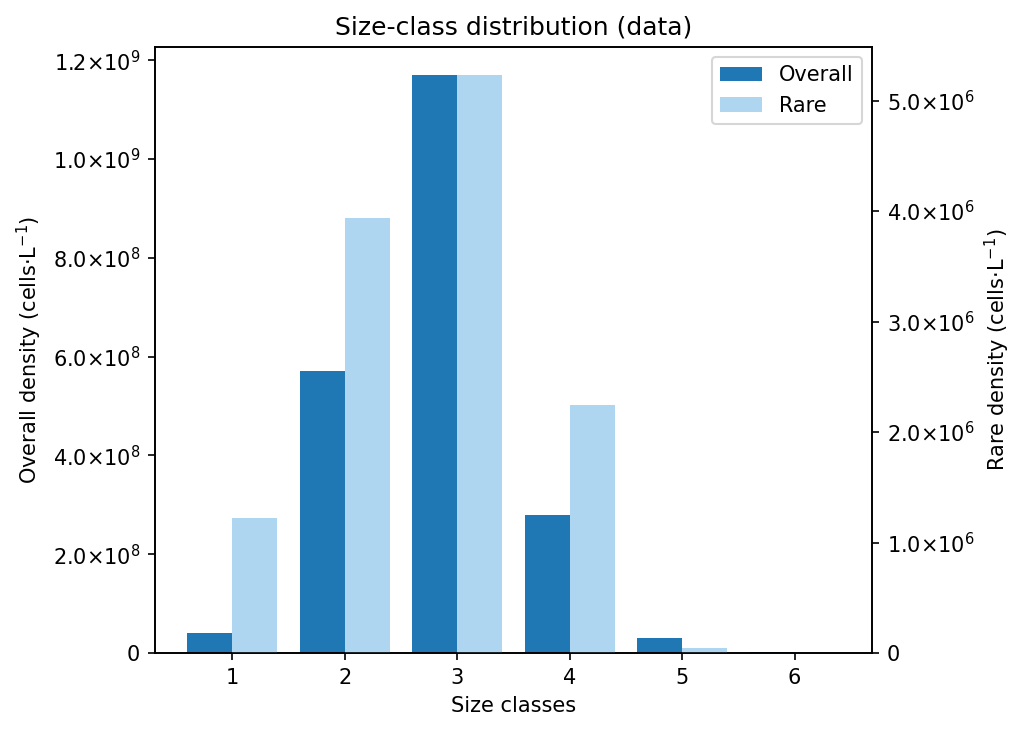
To investigate the contribution of rare and occasional taxa to phytoplankton size structure and community organization, we implemented a reproducible workflow (Fig. 1) composed of data integration, trait computation, aggregation, filtering and size-based analysis. Six phytoplankton datasets were retrieved from the LifeWatch Italy Data Portal and merged into a unified database. Prior to analysis, the dataset underwent a content and quality control procedure including taxonomic validation, geographic consistency checks, and the standardization of nomenclature and measurement units. Phytoplankton functional traits were computed using the Traits Computation service. For each taxon, individual cell measurements were used to estimate key morphological and functional traits such as biovolume, surface area, surface-to-volume ratio, density, biomass, cell carbon content, and their corresponding total values (total biomass, total carbon content, total biovolume). These data were subsequently aggregated from the individual level to the species level using the Data Aggregation service, in order to obtain a species-based trait dataset that could be compared across sites and ecoregions. To assess the contribution of rare taxa to community structure, the integrated dataset was progressively filtered using the Data Filtering service. Species were ranked according to their cumulative contribution to both total density and mean biovolume. Four threshold levels were applied (1%, 5%, 10% and 25%), and taxa contributing simultaneously to the lowest fractions of both metrics were removed at each step. This resulted in five datasets: the complete dataset (100%) and four filtered datasets retaining 99%, 95%, 90% and 75% of total density and mean biovolume, respectively. Size–density relationships were analysed using the Size Density Relationship service. For each dataset, linear regressions were computed between log-transformed average biovolume and total taxon density at both global and regional scales. The resulting slopes were compared with the theoretical scaling expectation of –¾ predicted by Damuth’s law for size–density relationships. Differences in slopes among filtering levels were tested using Analysis of Covariance (ANCOVA). Extremely rare taxa, defined as those contributing to less than 1%, 5%, 10% or 25% of total abundance and biomass and therefore removed during filtering, were further investigated in terms of taxonomic identity and body-size structure. Through the Size Class Distributionservice, the body-size structure of rare taxa was analysed using their mean biovolume, which was converted to a log₂ scale, forming 16 size classes with a size class width of 1 and clustering these classes into 6 ordered size classes (i.e., a cluster of 2, 3, 3, 3, 3, 2 classes) to characterise their distribution across size spectra.
Results and Discussion
Across the five ecoregions, a total of 306 phytoplankton taxa were identified. However, only 31 taxa accounted for 75% of total density and biovolume, while nearly half of the taxa were excluded at each filtering step (Figure 1, Table 1). In the full dataset, the size–density relationship exhibited a shallow negative slope, indicating weak scaling between body size and density due to the variability introduced by rare species.
Excluding the rarest 1% of taxa caused a marked shift (Figure 1b, Table 1): the slope became steeper and approached the theoretical −3/4 exponent predicted by metabolic theory, mainly due to the reduced influence of small-sized, low-density species. Further filtering (5–25%) resulted in even steeper slopes, in some cases exceeding −0.75, suggesting that dominant taxa conform more closely to size-scaling expectations than the full species pool. However, beyond the first 1% removal, additional filtering had only minor effects on the overall community size structure. At the regional scale (Figure 3), patterns were broadly consistent. In all five ecoregions, the exclusion of rare taxa steepened the size–density slope and reduced scatter, with the strongest change occurring after the 1% removal. Additional thresholds (5–25%) produced comparatively smaller adjustments. Slight differences in intercepts and variability reflect regional community composition, but the overall response to rarity filtering remained coherent across regions.
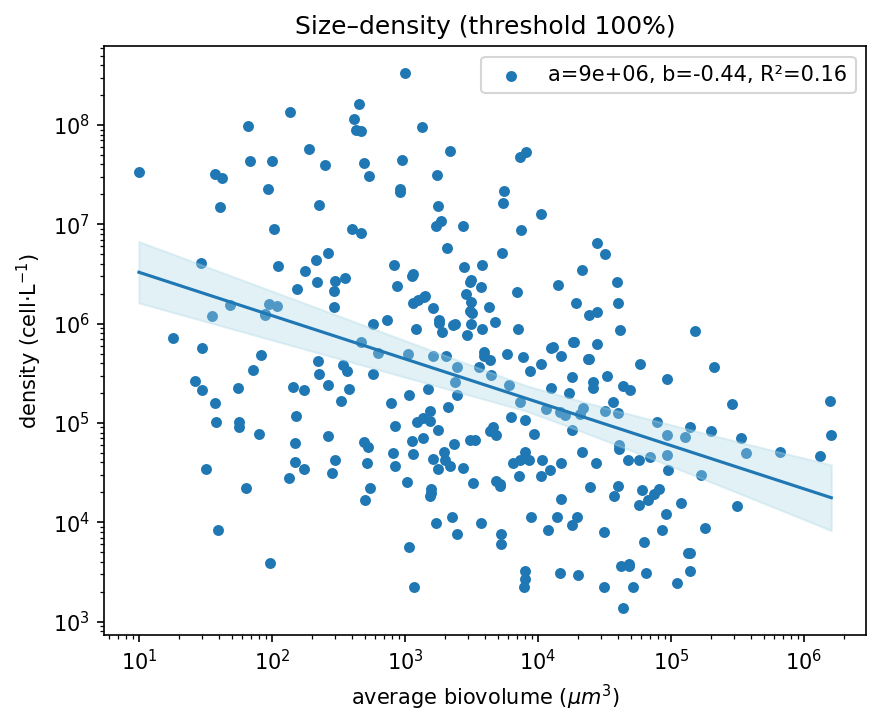
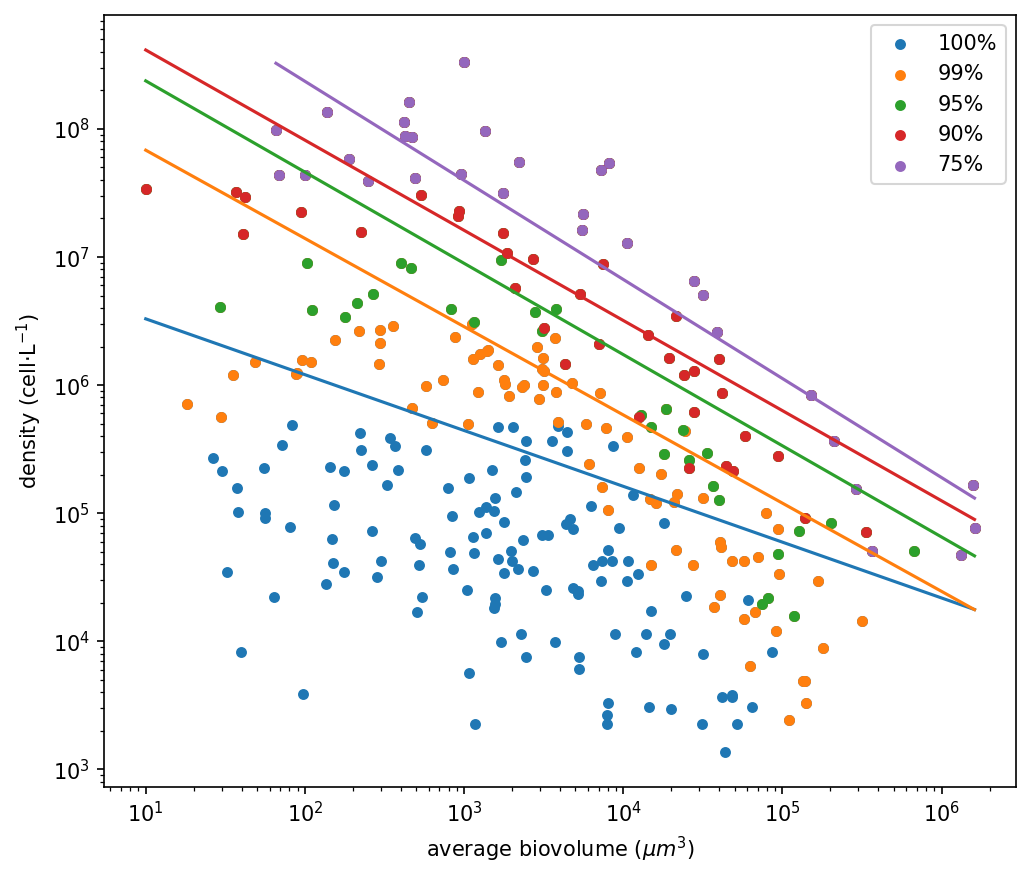
Figure 1 a) The total distribution of the phytoplankton community, including the rare taxa, in blue. b) the phytoplankton size–density relationship after the removal of rare species, after 1% removal of rare taxa in orange, after 5% removal in green, after 10% removal in red, and after 25% removal in purple.
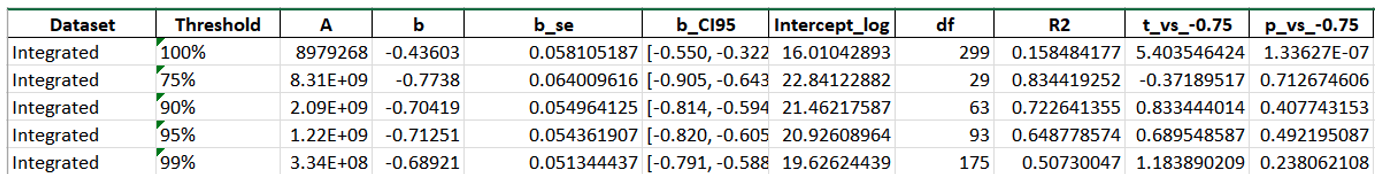


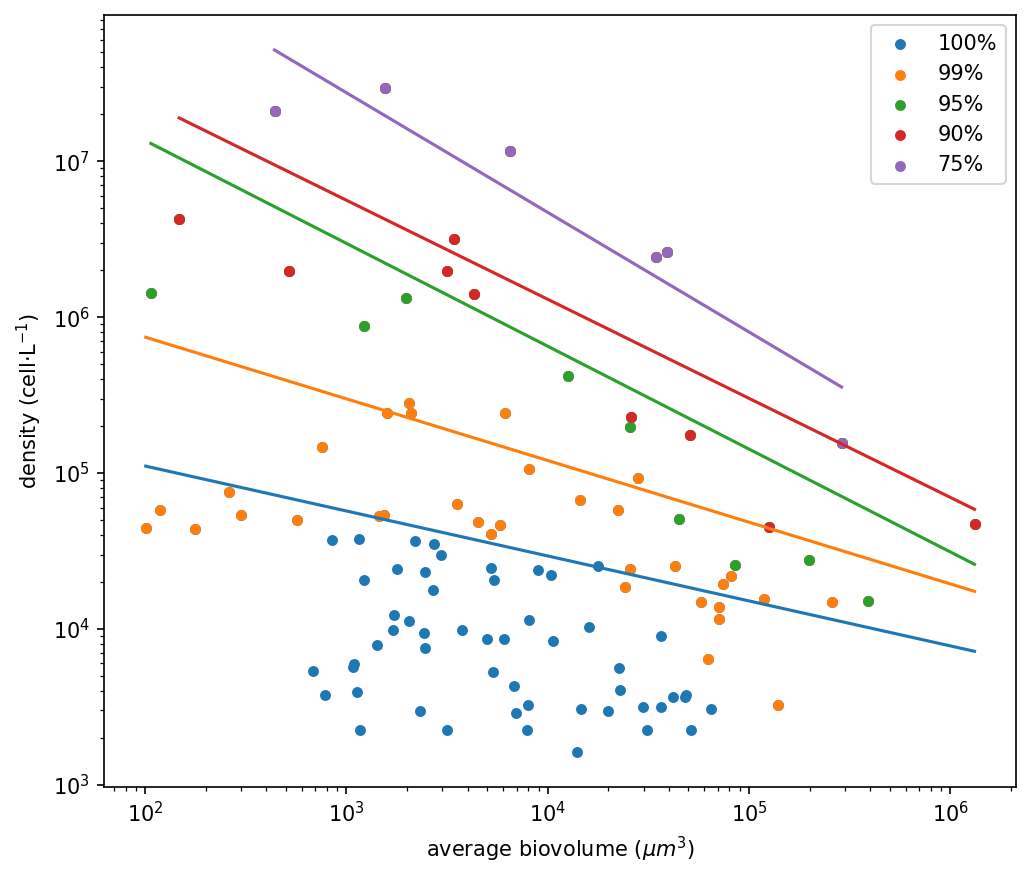


Figure 2 Size–density relationship, at regional level, for each of the five biogeographic regions: a) the Northern Atlantic Ocean (NAO), b) the Mediterranean Sea (MED), c) the Indo-Pacific Ocean (IPO), d) South-Western Atlantic Ocean (SWAO), e) the South-Western Pacific Ocean (SWPO). In all plots, the total distribution of the phytoplankton community, including the rare taxa, is represented in blue while the phytoplankton size–abundance relationship after 1% removal of rare taxa is shown in orange, after 5% removal in green, after 10% removal in red, and after 25% removal in purple.
Our findings show that extremely rare species, representing less than 1% of density and biomass, contribute disproportionately to the taxonomic and morpho-functional diversity of the lagoon phytoplankton communities investigated, both at global and regional level and that their exclusion significantly alters phytoplankton size–density relationships and community structure, demonstrating that rare species are not passive or negligible components of the system. Instead, they modulate morpho-functional organization and buffer the dominance of a few abundant taxa. This hidden reservoir of diversity likely enhances the long-term stability and resilience of primary producers in transitional water ecosystems. By providing functional redundancy, ecological insurance, and potential for rapid response to environmental change, rare species act as a “silent reserve” supporting the persistence and adaptability of phytoplankton communities over time. Overall, our results emphasize that even the rarest fraction of the community plays a key role in maintaining ecosystem stability and should be considered in ecological assessments and conservation strategies.
Technical notes
The data filtering, the size–density relationship and the size-class distribution computed in this workflow, as well as the statistical analysis, can also be applied to other traits such as density, mean carbon content, mean biovolume, mean biomass, or cell shape. The workflow can also be easily adapted to dataset with different spatial or temporal resolutions or to different taxonomic levels.
Possible applications of this workflow include:
- Analysis of the role of rare species using a single trait (e.g. density) instead of a combination of traits (e.g. density and mean biovolume);
- Application of different filtering thresholds (not necessarily 1–5–10%);
- Computation of size–density relationships and size-class distributions at different spatial or temporal scales;
- Data analysis at species level or at higher taxonomic levels.
A similar case study was conducted on the same dataset, but using numerical abundance per sample and biomass expressed as carbon content. For more details, see https://doi.org/10.3390/d16020098
References
Damuth, J. Population density and body size in mammals. Nature 1981, 290, 699–700.
Laraib, M., Titocci, J., Rosati, I. et al. An integrated individual-level trait-based phytoplankton dataset from transitional waters. Sci Data 10, 897 (2023). https://doi.org/10.1038/s41597-023-02785-w
Laraib, M.; Titocci, J.; Giannakourou, A.; Reizopoulou, S.; Basset, A. Role of Rare Species on Phytoplankton Size–Abundance Relationships and Size Structure across Different Biogeographical Areas. Diversity 2024, 16, 98. https://doi.org/10.3390/d16020098